Prepared by Thomas Johnson Associates, Substrata LLC, and CW Consulting Consulting firms specializing in water and environmental issues October 11, 2018
Introduction
This report presents results of a scientific study to assess potential impacts to drinking water from oil and gas drilling and production activities in Ventura County. This study evaluates the validity of claims that have been made by activist groups regarding environmental impacts of oil and gas drilling and production in the county.
The report focuses on groundwater quality in Ventura County (Figure 1) and presents data and
conclusions with respect to potential impacts of oil and gas production on groundwater in the County. This information was compiled from the California Environmental Protection Agency (Cal/EPA) State Water Resources Control Board (SWRCB), U.S. Geological Survey (USGS), California Department of Conservation, Division of Oil, Gas and Geothermal Resources (DOGGR) and water purveyors in Ventura County.
This report presents an evaluation of potential impacts from oil and gas production on water supplies. The report provides an evaluation of impacts to water supplies from other sources, including natural sources, agriculture, septic systems, urban development and other activities.
The report also includes a review and evaluation of claims by Citizens for Responsible Oil and Gas (CFROG), Food and Water Watch (F&WW), the Central Coast Alliance United for a Sustainable Economy (CAUSE), and others regarding impacts of oil and gas production on groundwater in Ventura County.
History of Oil and Gas Production in Ventura County
As early as the 1850s, oil from surface seeps and excavations was mined in Ventura County. The first commercial oil refinery began operation in 1861 in the Ojai valley (VCRMA 2018). By the 1880s, almost all of the state’s oil production was in Ventura County, with discoveries at Sulphur Mountain, Rancho Ojai, Rancho Sespe and Rancho Santa Paula (Figure 1). Discovery of the Ventura Avenue Oil Field
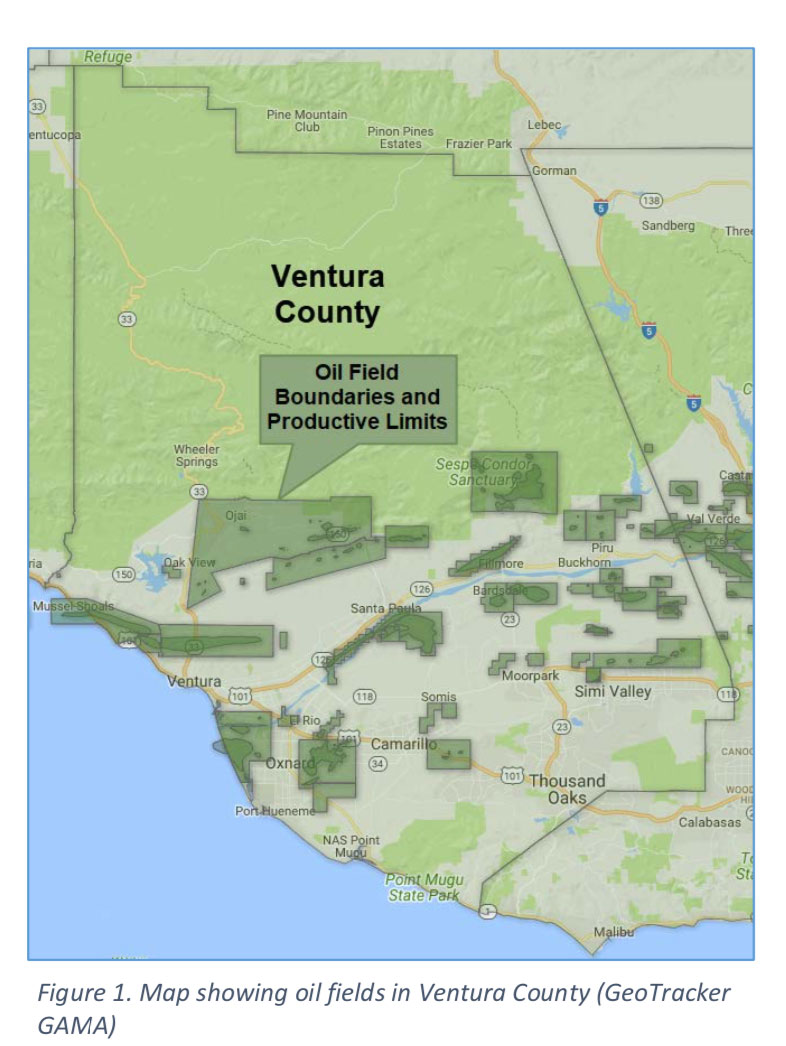
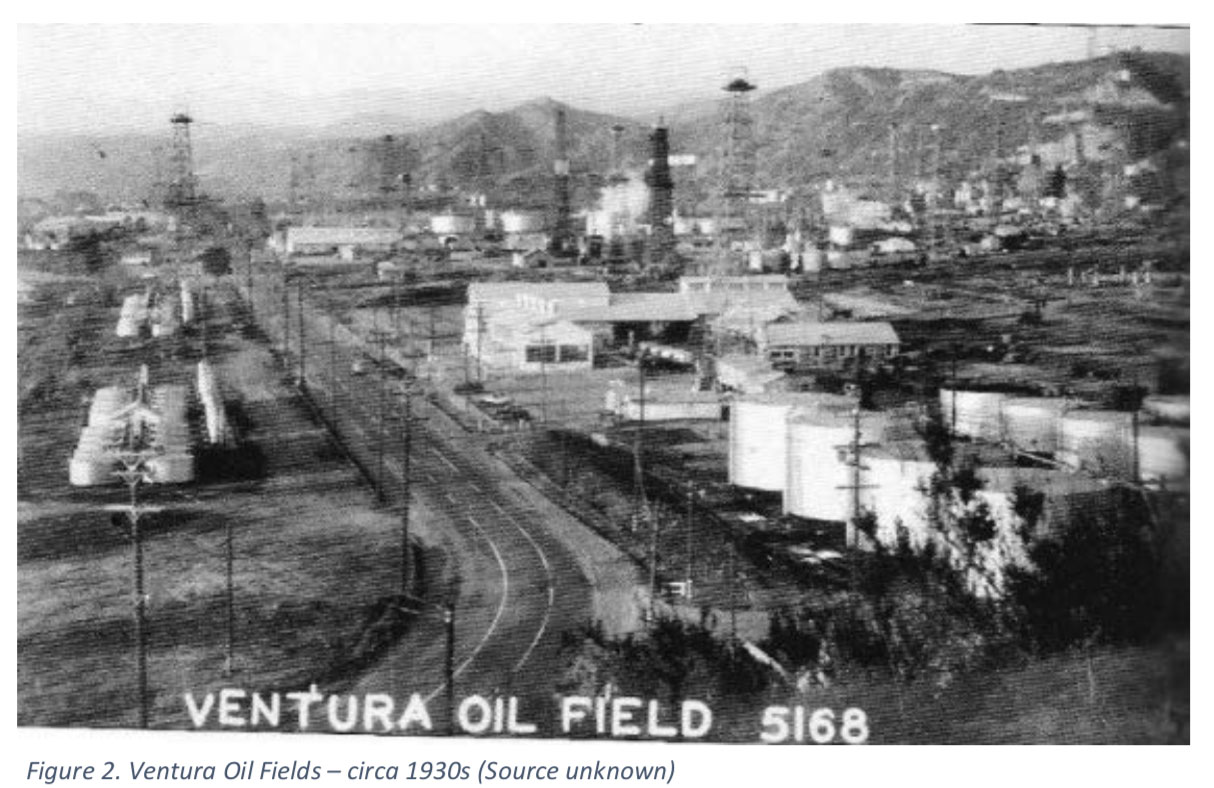
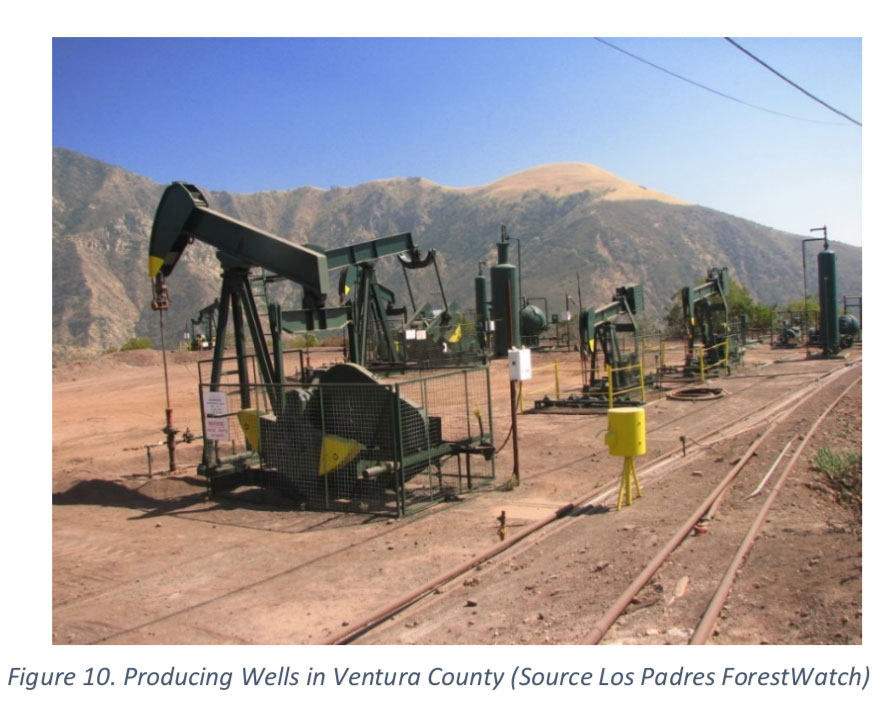
in 1916 (Figure 2) led to extensive population growth in the 1920s and subsequent decades. More than 12,000 oil and gas wells have been drilled in 34 oil fields within the county (VCRMA 2018). Currently, there are more than 3,800 active production wells and 43 producers and operators. There are also two major oil and gas processing facilities, pipelines and storage facilities in the county.
Groundwater Conditions and Use in Ventura County
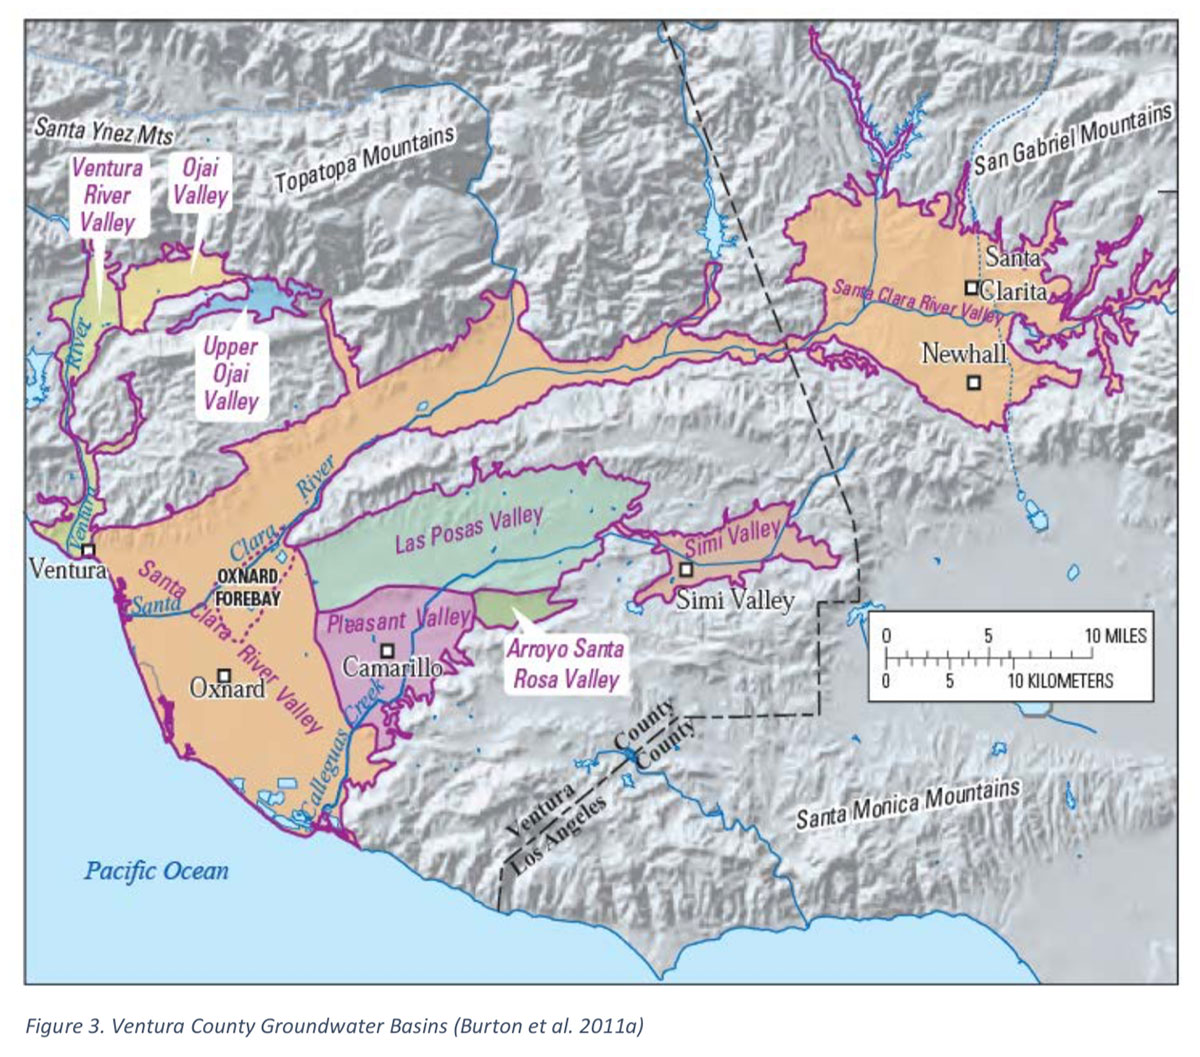
There are eight primary groundwater basins in Ventura County: Ojai Valley, Upper Ojai Valley, Ventura River Valley, Santa Clara River Valley, Pleasant Valley, Arroyo Santa Rosa Valley, Los Posas Valley, and Simi Valley (Figure 3) (DWR 2003; Burton et al. 2011a, 2011b).
The primary aquifer system in the Ventura River Valley, Ojai Valley, Upper Ojai Valley, and Simi Valley consists primarily of unconfined alluvium. In the other basins, the primary aquifer system consists of unconfined sands and gravels overlying partially confined marine and non-marine sediments (Burton et al. 2011a, 2011b). Public water-supply wells are generally installed at depths ranging from 200 to 1,100 feet, with solid casings ranging from 60 to 700 feet deep. The primary aquifer system in the County is generally separated from oil-bearing formations by thousands of feet of sediments, isolating oil and gas production zones from water supply aquifers.
Recharge to the groundwater system is through stream-channel infiltration from the rivers and creeks, irrigation return flow, and rainfall infiltration. The primary use of groundwater in these basins is for agriculture, which constitutes 37 percent of the land use area in these basins (Burton et al. 2011b). Primary crops include citrus, avocados, alfalfa, pasture and strawberries. Groundwater also provides a substantial proportion of municipal water use in the county, which is supplemented by imported and regional surface-water supplies. Primary urban areas in the County include the cities of Ventura, Oxnard, Camarillo, and Simi Valley.
Groundwater Quality – Ventura County
Groundwater quality in Ventura County primarily reflects interaction of the water with surrounding soil and rock, and the quality of the water sources that recharge groundwater. Impacts from agricultural activities, urban development, septic systems, wastewater treatment, and commercial activities have also affected groundwater quality in the county.
There have been many studies of groundwater conditions and water quality in Ventura County by state and federal agencies, water districts, the county, cities, local agencies and other organizations. The U.S. Geological Survey (USGS) conducted a study of groundwater quality in the primary aquifers of groundwater basins in Ventura County that involved sampling of 53 water supply wells, most located in or near oil fields (Figure 4) (Burton et al. 2011a, 2011b).
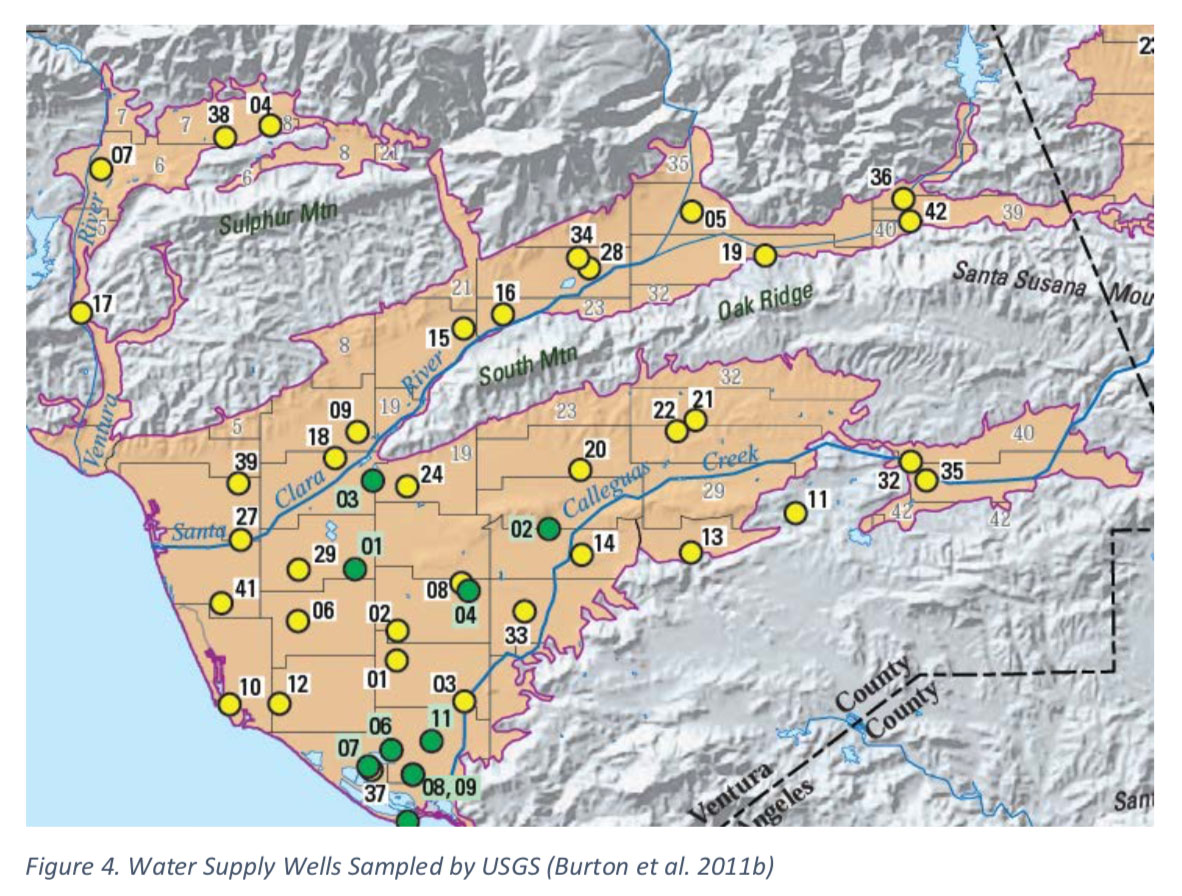
Results of water well sampling by the USGS, Ventura County and water districts indicated that:
The Ventura County Watershed Protection District prepares annual reports of groundwater conditions in the county. This includes sampling of hundreds of water supply wells. The 2015 Annual Report of Groundwater Conditions – Ventura County included results from sampling of 221 of 4,016 active watersupply wells in the county (VCWPD 2016). Findings from that report include:
The California SWRCB maintains a comprehensive database of groundwater sampling results in conjunction with the Groundwater Ambient Monitoring and Assessment (GAMA) program. This database includes sampling data from hundreds of public water supply wells in Ventura County, including wells in or near oil fields (Figure 5).
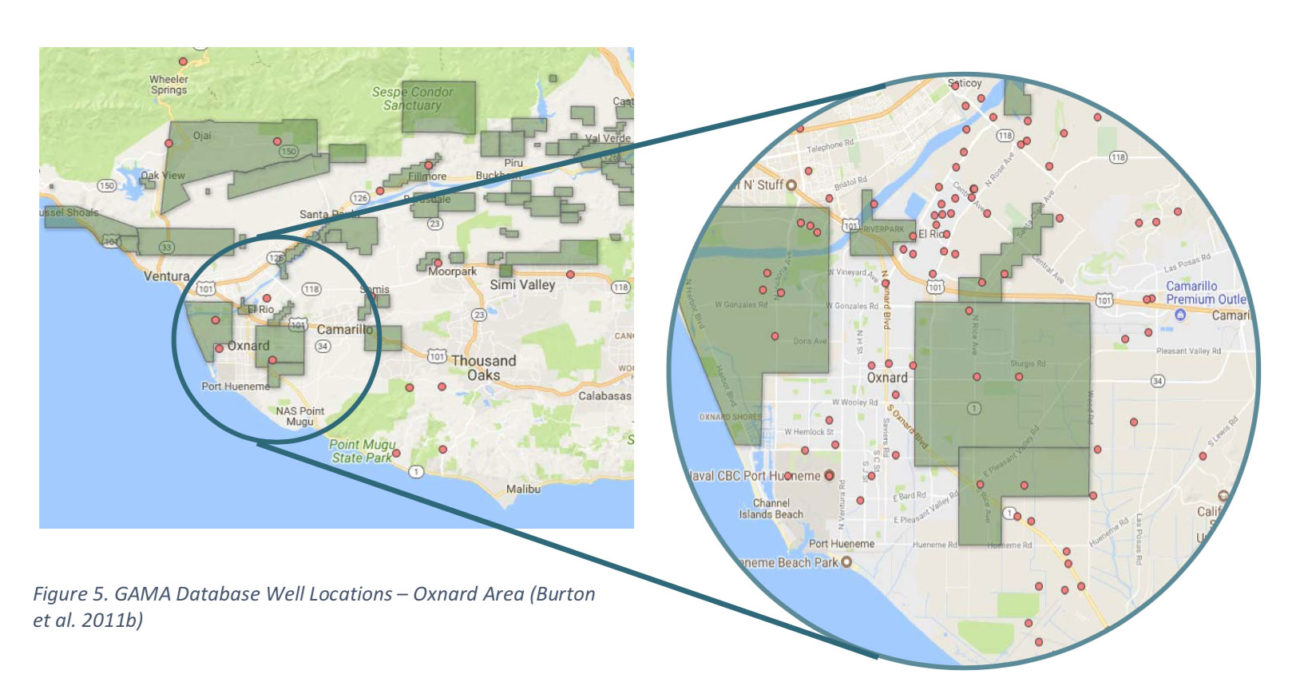
Sampling results from the SWRCB GAMA database for Ventura County indicate:
Water Quality – Santa Clara River Valley
Surface-Water and Groundwater Sampling
Surface-water and groundwater resources in the Santa Clara River Valley are managed by the United Water Conservation District (UWCD 2017). This includes sampling of surface water and 155 groundwater wells and evaluation of potential sources of contamination associated with water quality issues.
• Oil and gas production was not listed as a possible source of surface-water or groundwater
contamination associated with sampling of these water-supply wells
Surface Water – Primary surface-water quality issues in the Santa Clara Valley are chloride and total
dissolved solids (TDS) from naturally-occurring sediments and wastewater treatment plant effluent.
Groundwater – Sources of groundwater quality issues in the Santa Clara Valley include:
Sanitary Survey
Sanitary surveys are required by the USEPA for watersheds where groundwater supplies are determined to be “under the influence of surface water”. The purpose of the sanitary survey is to assess potential sources of contamination near water-supply wells. UCWD conducted a sanitary survey in 2010 for the Santa Clara Valley (UCWD 2011).
• Oil and gas production was not listed as a possible contamination source in the 2010 sanitary
survey of the Santa Clara Valley
The 2010 sanitary survey identified the following primary potential sources of groundwater contamination in the Santa Clara Valley:
Water Quality – Ventura River Valley
A sanitary survey was conducted in 2010 for the Ventura River/San Antonio Creek watershed (KJC 2010). This survey included the Upper Ventura River and Ojai/San Antonio Creek area. The 2010 sanitary survey of the Ventura River/San Antonio Creek watershed identified the following sources of groundwater contamination:
The Ventura River/San Antonio Creek watershed survey also identified the following potential contamination sources:
Water Purveyors
[insert Figure 6 to right side]
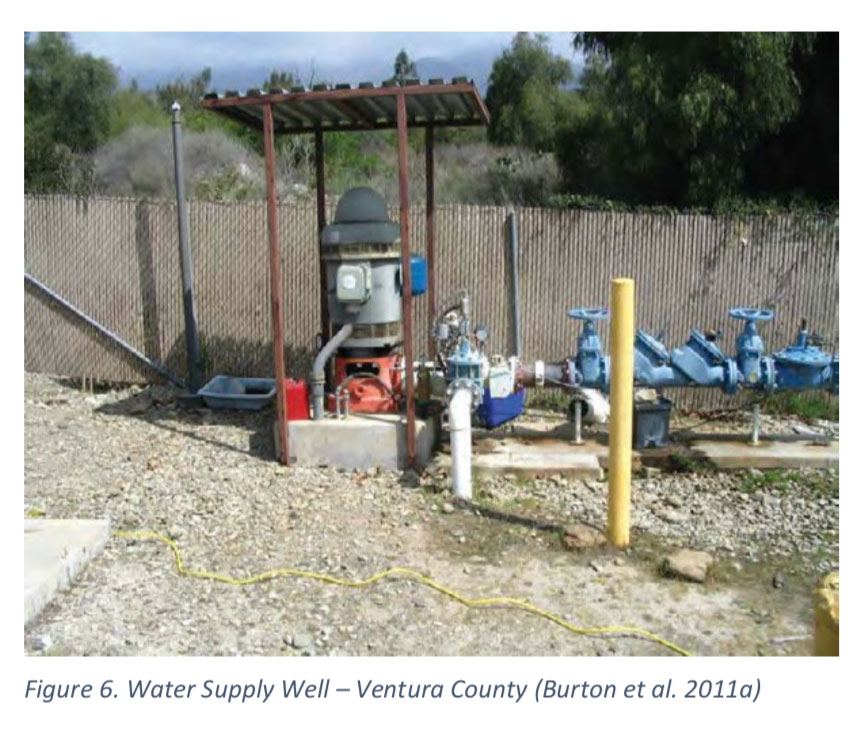
Water purveyors rely on both surfacewater and groundwater supplies. The primary source of drinking water in the county is imported surface water from the State Water Project (SWP), the Colorado River primarily provided by the Metropolitan Water District of Southern California (MWD). Surface water from reservoirs in Ventura County, including Lake Casitas, is also used for water supply. Groundwater is an important source of water for water purveyors, representing approximately 67 percent of the total volume of water used in the county for domestic and agricultural use (Figure 6).
California regulations (Title 17 and Title 22 of the California Code of Regulations (CCR) and the U.S. Safe Drinking Water Act) require that purveyors routinely test their water supplies for a wide range of chemical constituents, including petroleum compounds (SWRCB 2018a). Water purveyors are also required to prepare annual water-quality or consumer confidence reports presenting water quality sampling results, and evaluation of potential sources of contamination of their water supplies.
Water Purveyor Annual Water Quality Reports
Annual water quality reports prepared by Ventura County water purveyors reported indicated that:
Water Purveyor Statements
Water purveyors in Ventura County uniformly report that their water supplies meet stringent water quality standards. Following are statements about water quality from Ventura County water purveyors:
Ventura Water: “Drinking water met all state and federal Standards” (Ventura Water 2017)
City of Santa Paula: “In a matter of only a few decades, drinking water has become exponentially safer and more reliable that at any other point in human history.” (City of Santa Paula 2017)
Casitas MWD: “Your tap water is safe to drink.” “There have been no contaminants detected in our
water supply” (Casitas MWD 2017)
City of Fillmore: “Over the years, we have dedicated ourselves to producing drinking water that meets all state and federal standards.” (City of Fillmore 2016)
Ojai – Golden State Water Co.: “You should rest assured knowing that Golden State Water tests water delivered to its customers to ensure it meets stringent quality standards.” (GSWC 2017)
City of Port Hueneme: “Your water meets all USEPA and SWRCB water quality standards. None of the constituents in the drinking water exceeded the maximum contaminant levels or notification levels set by the USEPA or SWRCB.” (City of Port Hueneme 2016)
United Water Conservation District: “Last year we conducted thousands of tests for over 180 chemicals and contaminants that could be found in your drinking water supply. We did not detect any contaminants that would make the water unsafe to drink.” (UWCD 2018)
Environmental Activist Groups – Claims Regarding Impacts of Oil and Gas Production
Environmental activist groups have recently made claims regarding alleged impacts of oil and gas production on water resources in Ventura County. These groups include Citizens for Responsible Oil and Gas (CFROG), Food and Water Watch (F&WW), and Central Coast Alliance United for a Sustainable Economy (CAUSE).
Citizens for Responsible Oil and Gas (CFROG)
In 2016, CFROG submitted a report to Ventura County Board of Supervisors alleging that oil and gas production has impacted groundwater in the county (CFROG 2016). CFROG made the following claims:
“…oil and gas exploration and production activities have contaminated groundwater aquifers within Ventura County…”
“The potential for such pollution is ongoing.”
“Wastewater injection wells have and are continuing to inject wastewater into protected aquifers in Ventura County.”
The primary focus of the 2016 CFROG report was on sumps, wastewater injection wells, and well
stimulation – hydraulic fracturing.
The 2016 CFROG report also included a technical memorandum prepared by Newton Geo-Hydrology
Consulting (Newton 2016) which made the following claims:
“Discharge of drilling, well completion and production fluids to land “may
pose a significant threat to water quality…”
“the presence of toluene and high concentrations of inorganic compounds in exceedance of the
MCL for drinking water are present in …water wells.”
“Based on these findings there is cause for concern that oil and gas exploration and production
activities have contaminated groundwater aquifers within the County of Ventura.”
The CFROG 2016 Newton memorandum included claims regarding impacts to water resources involving three example cases: 1) Oxnard area metal-lined tank, 2) Ojai area cement-lined sump, and 3) unlined oil-field sumps (Newton 2016).
[Insert Figure 7]
1. Oxnard area – Metal-lined tank
An inspection of this facility by the California Regional Water Quality Control Board-Los Angeles Region (RWQCB) found a metal-lined, underground storage tank (Figure 7). The tank was approximately 5 feet in diameter and contained approximately 5 feet of oil and water. Newton concluded that there was an “open investigation as to condition of the groundwater because there was a water supply well 200 feet southeast of facility.
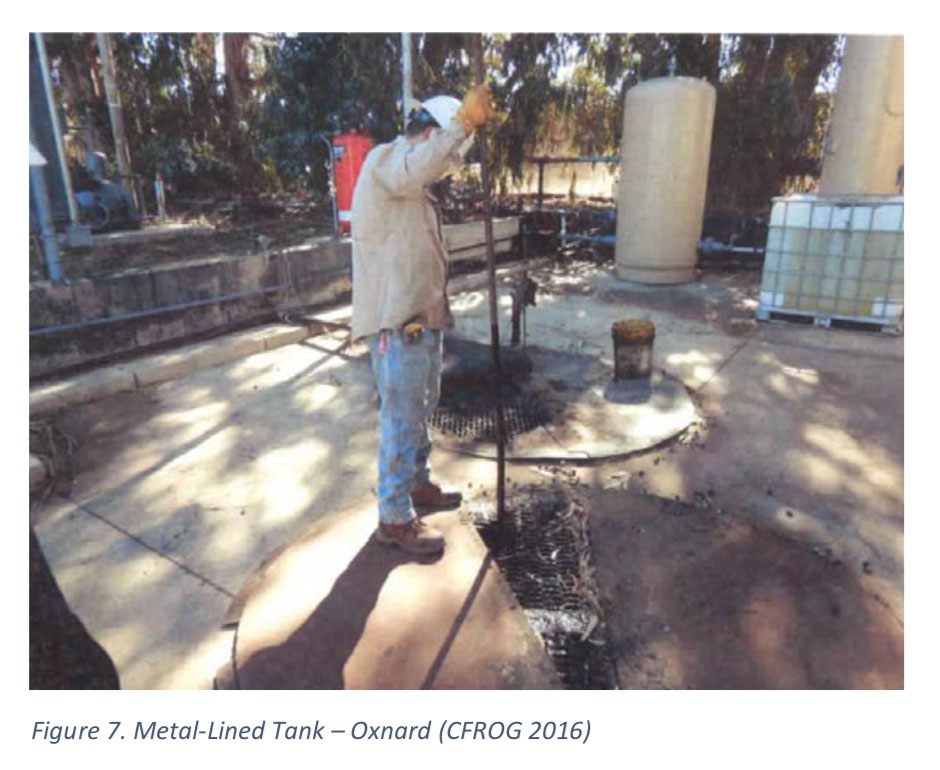
Response: There is no information to suggest that there was any release of petroleum from this lined tank to the underlying soil or groundwater. The very small tank is lined and contained liquids at the time of the inspection, indicating that the tank was not leaking, and did not pose a threat to any water supplies. Furthermore, the RWQCB determined that further investigation of possible groundwater impacts from this tank was not warranted.
The RWQCB issued an investigative order for this facility requiring the operatorto provide information regarding conditions at a former oil-field sump in the Ojai Oil Field (Figure 8). Information provided by the operator indicated that the sump, which was cement-lined and approximately 125 feet by 25 feet in area, was closed and removed in 1997 under regulatory oversight. Because the cement lining was found to be cracked and the sump had leaked, additional soils were excavated to remove impacted soils for off-site disposal.
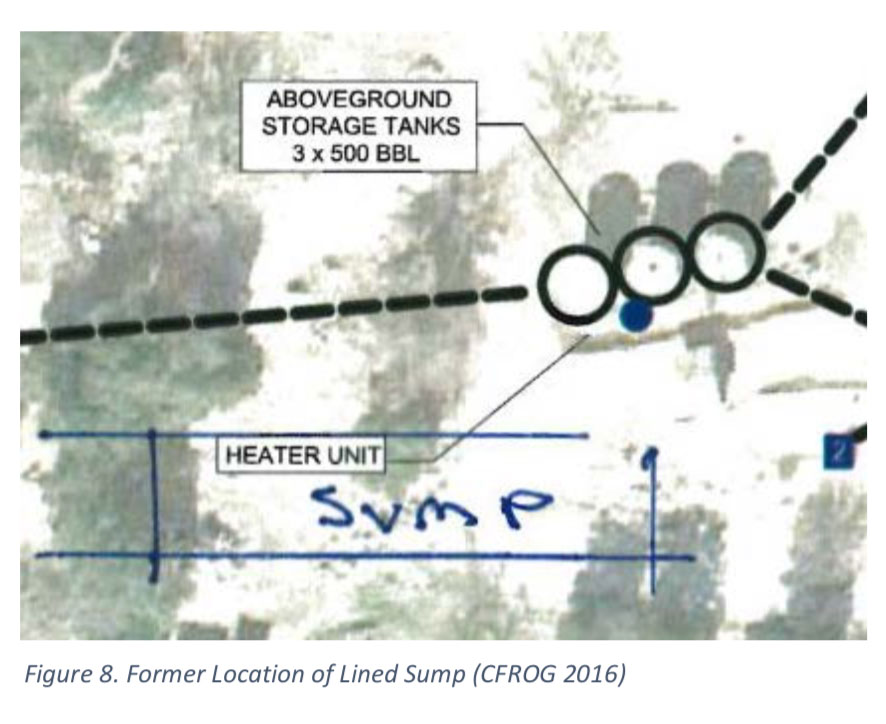
The field operator also sampled several private water supply wells in the area within the oil field, approximately one-quarter mile of the sump location. Water samples from these wells contained concentrations of dissolved solids as high as 1,640 mg/L TDS and 620 mg/L chloride, as well as elevated levels of iron, manganese and nitrate concentrations. A trace level of toluene (0.6 micrograms per liter (µg/L)) was also found in one well.
Based on those findings, CFROG (2016) concluded that: “fresh water… in Upper Ojai appears to be contaminated by oil and gas production activities.”, and Newton (2016) concluded that “there is cause for concern that oil and gas exploration activities have contaminated groundwater
aquifers within the County of Ventura.”
Response: There is no evidence that oil and gas production activities at this site impacted groundwater or any water supply wells. Groundwater in this oil field area contains naturallyhigh concentrations of dissolved solids, chloride, iron, manganese derived from sediments in the geologic formations (VCWPD 2016). Average TDS concentrations in Ventura County groundwater commonly exceed 1,600 mg/L (DWR 2003). The levels of dissolved solids (up to 1,640 mg/L) and chloride (up to 620 mg/L) in the private wells cited by CFROG are similar to those found in groundwater elsewhere in the County and the Ojai area (VCWPD 2016). High concentrations of nitrate from agricultural use are also common in the area. The trace concentration of toluene (less than 1 µg/L) in only one well is not unexpected in an oil-field area, where geologic formations naturally contain petroleum hydrocarbons. This concentration of toluene is far less than the public drinking water standard of 150 µg/L.
3. Unlined sumps
Newton (2016) also expressed concerns regarding the current and historical use of unlined oilfield sumps. In 2015, the RWQCB sent letters to all producers in the region, requesting information on current and former oil-field sumps and/or ponds. Due to the ages of most oil fields, information was not available for most abandoned and closed sumps and ponds in Ventura County. Newton (2016) and CROG (2016) concluded:
“…for decades, sumps like these were used to dispose of produced water through
percolation into the ground and potentially the groundwater.”
“We do not know if the groundwater . . . was polluted at this location . . . Because . . .
there are no water wells . . . thus testing for fresh water contamination could not be
done.”
Response: Newton and CFROG provide no evidence or information to indicate that the current
or historical use of oil-field sumps and ponds have impacted any drinking water supplies or
water resources.
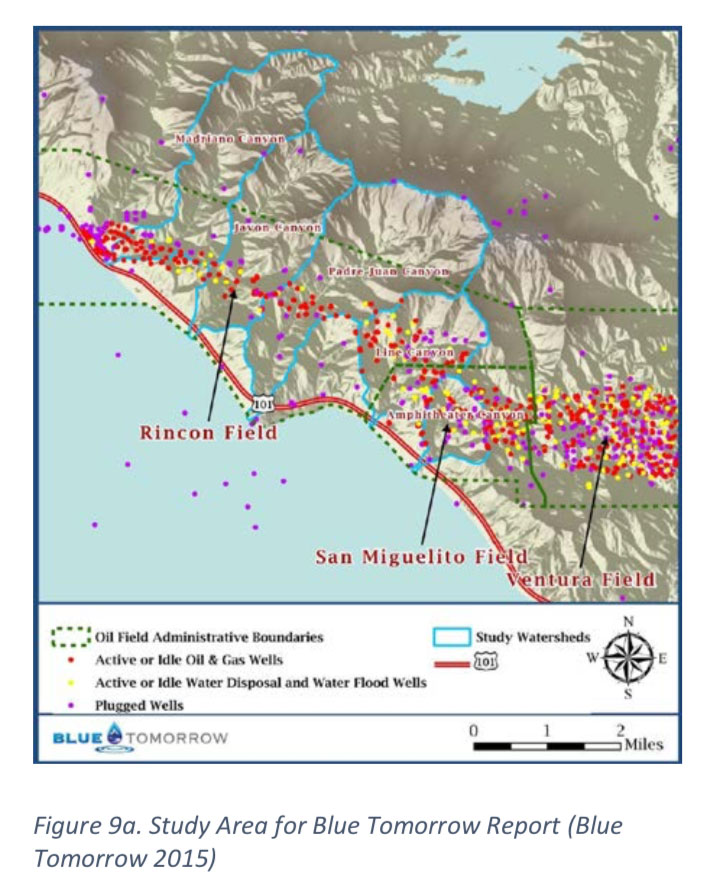
Blue Tomorrow
In 2014, Blue Tomorrow Consultants and Dr. Arturo Keller prepared the report “Northern Ventura County Coastal Watershed Project” (Blue Tomorrow 2014). The report presented results of a study of storm-water, stream and sediment sampling in an oil-field area of northern Ventura County (Figure 9a). The Blue Tomorrow reported that surface water near the bottom of the drainage areas contained elevated concentrations of TDS (up to 10,000 mg/L), suspended solids, metals, chloride, sulfate and total petroleum hydrocarbons as diesel (TPHd, 2.3 mg/L). Sediments at the base of the drainage area were reported to contain elevated concentrations of metals, salts and polynuclear aromatic hydrocarbons (PAHs).
Based on these findings, Blue Tomorrow (2014) concluded that there were concerns regarding impacts to surface water, sediment and groundwater from oil and gas production activities, including oil-field runoff and discharges, hydraulic fracturing, and water injection.
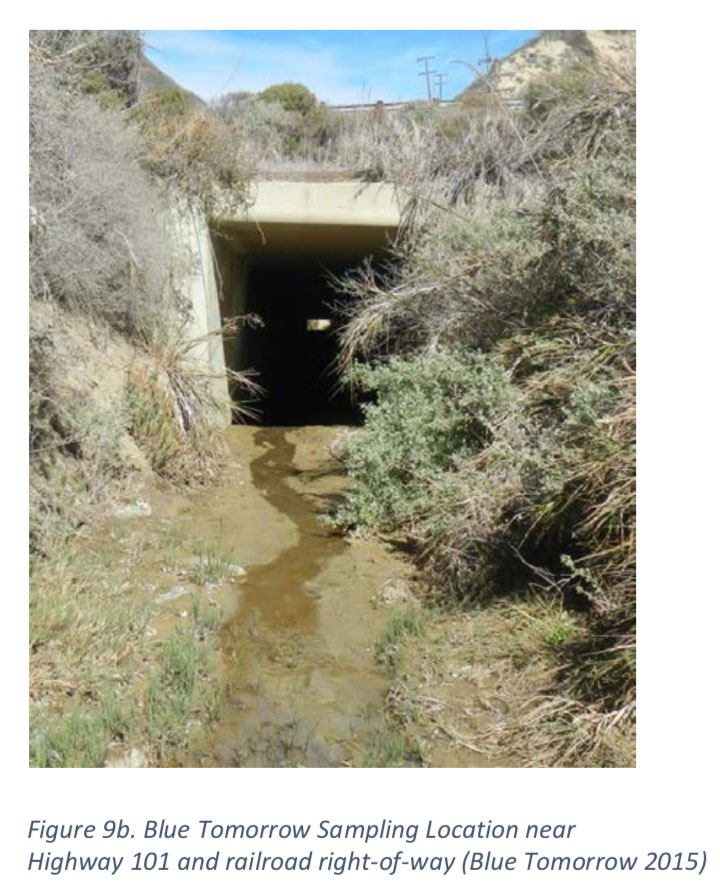
Response: Many surface-water and sediment samples collected by Blue Tomorrow were from the
extreme downstream outlets of the watersheds (Figure 9b), which increases the potential for other contributing sources, and makes attribution of sources difficult if not impossible. As a result, the study conclusions are not supported by Blue Tomorrow’s own data. For example, the report concludes that “The study indicates impacts to water quality from various upstream oil production operations.” However, the report later admits that “As samples were not collected from areas upstream of oil field operations, pollutants attributable to these land uses could not be verified.”
Blue Tomorrow acknowledges that “Soils and geology are the main source of metals and salts found in stormwater and sediment samples” and “The marine sedimentary rocks in the region are significant hydrocarbon sources…” Natural erosion contributes naturally occurring hydrocarbons to the watershed, since surface geologic formations in the watersheds contain petroleum hydrocarbons. This supports Blue Tomorrow‘s own conclusion that “The primary sources of sediment, metals and salts found stormwater runoff are upstream geology and soils” and the detected organic contaminants are derived from erosion of “hydrocarbon-rich” marine sediments, not from oil and gas operations.
Blue Tomorrow incorrectly dismisses pollutant impacts to stormwater and sediment from vehicle and railroad transportation activities adjacent to their downstream sampling locations, even though their report indicates that “Oils and greases and other organic compounds, including polycyclic aromatic hydrocarbons (PAHs) also result from transportation activities.” Blue Tomorrow’s stormwater and sediment sampling locations were all located close to or downstream from U.S. Highway 101 or Union Pacific Railroad tracks; however, Blue Tomorrow incorrectly dismisses highway runoff and railroad activities as sources of pollutants.
Oil and Gas Exploration and Production
• Strict regulations and industry practices for oil and gas drilling in California provide protection for groundwater resources. This includes requirements for isolating oil and gas wells from surrounding and overlying groundwater, and stringent monitoring and inspection of oil and gas production and injection wells.
• Review of information on the SWRCB GeoTracker database found no evidence of impacts to drinking water supplies attributed to oil and gas production in Ventura County. Petroleum-related impacts to groundwater in the Ventura County are primarily associated with gas stations, transportation facilities, refineries and oil storage and terminal facilities. There were no exceedances of water quality standards for petroleum chemicals, including benzene, toluene, ethylbenzene, xylenes (BTEX) and total petroleum hydrocarbons (TPH). Historically, there have been a few detections of petroleum chemicals, consisting primarily of refined hydrocarbons (BTEX) mostly near the limits of detection (SWRCB 2017).
• In their comprehensive studies of groundwater quality in the Santa Clara River Valley, which consists of eight groundwater basins in Ventura County, the USGS and SWRCB sampled 53 supply wells in the area. Most of these wells are located in or near oil fields. The study did not identify oil and gas production as a source of groundwater contamination (Montrella and Belitz 2009; Burton et al. 2011a, 2011b).
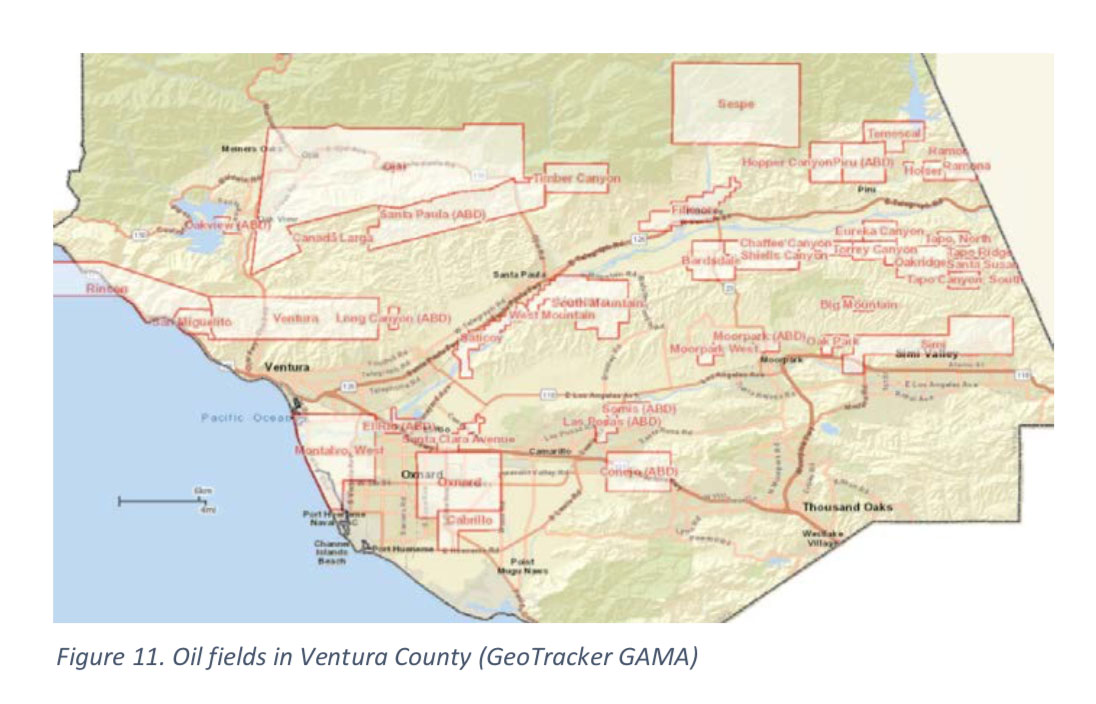
“The Sespe Oil and Gas Field does not overlie a groundwater basin or sub-basin.”
“Groundwater resources are not likely to be in direct hydraulic connection with the adjacent groundwater basin…”
Petroleum Cases – SWRCB-GeoTracker/USEPA
SWRCB GeoTracker Sites
The California SWRCB maintains the GeoTracker database which includes sites where contaminant releases have occurred to soil, groundwater or surface water. The GeoTracker database currently includes approximately 1,638 open or closed cases in Ventura County. These cases include dry cleaner sites, service station underground storage tank (UST) cases, industrial sites, land disposal facilities, oildistribution pipelines, oil storage and processing facilities, and refineries.
There are currently 84 GeoTracker cases in Ventura County classified as open within the Site Cleanup Program. Open Site Cleanup Program cases include those sites where investigation or remedial efforts are ongoing, or sites that may have been closed but the database has not been updated by the RWQCB. Approximately 10 of the 84 open GeoTracker cases are petroleum or oil-field related. Impacts from these petroleum-related sites include the release of petroleum hydrocarbons or metals to soil and/or localized impacts to shallow groundwater or surface water. None of these sites was found to impact drinking-water supplies.
The RWQCB has also issued letters to all oil-field operators in Ventura County, requesting information on current and historical oil-field sumps and injection wells. While limited information is available for most historical facilities this review has not identified impacts to groundwater resources.
USEPA Sites
There is one site in Ventura County that is listed on the USEPA National Priorities List (NPL) of Superfund Sites, a former refinery in Fillmore, California. Releases of petroleum occurred at that site to soil and shallow groundwater; however, this impacted groundwater is not a source of drinking water supply (Chevron 2011). Monitoring and remediation are ongoing at that site. The USEPA also has provided regulatory oversight for investigation and remediation of a former refinery in the lower Ventura River Valley. Investigations of soil and shallow groundwater impacts have been completed, and the USEPA has determined that all removal actions have been completed and there is no threat to the Ventura River (VRWC 2015).
Conclusions
Information Sources
Aspen Environmental Group (Aspen). 2015. Final Environmental Impact Report. Analysis of Oil and Gas
Well Stimulation in California. Prepared for California Department of Conservation. June.
ftp://ftp.consrv.ca.gov/pub/oil/SB4EIR/EIR/Volume%20III.pdf
Blue Tomorrow and A. Keller (BT). 2014. Northern Ventura County Coastal Watershed Project.
Prepared for the Rose Foundation for Communities and the Environment.
https://rosefdn.org/wp-content/uploads/2014/11/NVCCWP_Final-Report.pdf
Burton, C.A., Landon, M.K., and Belitz, K. 2011a. Ground-Water Quality in the Santa Clara River Valley, California. U. S. Geological Survey (USGS) and California State Water Resources Control Board (SWRCB) Fact Sheet 2011-3055. June. https://pubs.usgs.gov/fs/2011/3055/
Burton, C.A., Montrella J., Landon, M.K., and Belitz, K. 2011b. Status and Understanding of GroundWater Quality in the Santa Clara River Valley. 2007 – California GAMA Priority Basin Project. U. S. Geological Survey (USGS) Scientific Investigations Report 2011-5051. 86p. https://pubs.usgs.gov/sir/2011/5052/pdf/sir20115052.pdf
California Council on Science and Technology (CCST). 2015. Chapter Four, A Case Study of the Petroleum Geological Potential and Potential Public Health Risks Associated with Hydraulic Fracturing and Oil and Gas Development in the Los Angeles Basin. August.
http://ccst.us/publications/2015/160708-sb4-vol-III-4.pdf
California Department of Water Resources (DWR). 2003. California’s groundwater: California Department of Water Resources Bulletin 118, 246 p.
https://www.water.ca.gov/Programs/Groundwater-Management/Bulletin-118
California Division of Oil, Gas, & Geothermal Resources (DOGGR). 2016. Well Stimulation Treatment Annual Report. Reporting Period: July 1, 2015 – June 30, 2016
ftp://ftp.consrv.ca.gov/pub/oil/WST_Annual_Reports/WST_2016_Report.pdf
______. 2017. Well Count and Oil and Gas Production by County, 2016.
ftp://ftp.consrv.ca.gov/pub/oil/annual_reports/2016/Wells_and_Production_by_County_2016.pdf
______. 2018. Aquifer Exemption Information.
http://www.conservation.ca.gov/dog/Pages/Aquifer_Exemptions.aspx
California State Water Resources Control Board (SWRCB). 2017. GeoTracker database.
https://geotracker.waterboards.ca.gov/
_____.2018a. California Drinking Water-Related Laws
https://www.waterboards.ca.gov/drinking_water/certlic/drinkingwater/Lawbook.html
_____. 2018b. Water Quality in Areas of Oil and Gas Production.
https://www.waterboards.ca.gov/water_issues/programs/groundwater/sb4/
Cardno ENTRIX. 2012. Ventura River Watershed Protection Plan Report. Prepared for Ventura County
Watershed Protection District. February. http://www.uvrgroundwater.org/wpcontent/uploads/2016/02/WPD_VenRiv_Wtrshd_Protect_Plan_Rprt.pdf
Casitas Municipal Water District (Casitas MWD). 2017. 2017 Drinking Water Annual Water Quality
Report – 2016 Data.
http://www.drivecms.com/uploads/casitaswater.org/4CMWD%20Water%20Quality%20Report%20%202017.pdf
Chevron Environmental Management Company (Chevron). 2011.
https://fillmoreworks.com
City of Fillmore. 2016. Annual Water Quality Report – Water Testing Performed in 2015.
http://www.fillmoreca.com/home/showdocument?id=826
City of Santa Paula. 2017. Annual Water Quality Report, Water Test8ing Performed in 2016. PWS ID#: 5610011.
http://www.ci.santa-paula.ca.us/WaterQualityReport.pdf
Citizens for responsible Oil and Gas (CFROG). 2016. Inquiry into Potential Water Contamination from Oil and Gas Activities including Sumps and Wastewater Wells in Ventura County. Letter to Ventura County Board of Supervisors. October 14.
https://d3n8a8pro7vhmx.cloudfront.net/cfrog/pages/161/attachments/original/1476483596/FINAL_CFROG_Report_Water_Contamination.pdf?1476483596
Daniel B. Stephens & Associates, Inc. (DBSA). 2017. Santa Paula Basin Hydrogeologic Characterization and Safe Yield Study, Ventura County, California. Prepared for United Water Conservation District. https://pubs.usgs.gov/wri/wri024136/wrir024136.pdf
Davis, T., M. Landon, and G. Bennett. 2018. Prioritization of Oil and Gas Fields for Regional Groundwater Monitoring Based on a Preliminary Assessment of Petroleum Resource Development and Proximity to California’s Groundwater Resources. U.S. Geological Survey, Scientific Investigation Report 2018-5065.
Fox Canyon Groundwater Management Agency (FCGMA). 2016. Annual Report for Calendar Year2015.
http://www.fcgma.org/public-documents/reports
Golden State Water Company. 2017. Ojai Water System Consumer Confidence Report on Water Quality
for 2016. http://www.gswater.com/wp-content/uploads/2017/04/Water-Quality-2017-Ojai.pdf
Hanson, R.T., P. Martin, and K. Koczot. 2003. Simulation of Ground-Water/Surface-Water Flow in the Santa Clara-Calleguas Ground-Water Basin, Ventura County, California. U.S. Geological Survey, Water-Resources Investigations Report 02-4136.
https://pubs.usgs.gov/wri/wri024136/wrir024136.pdf
Izbicki, J.A. 1996a. Seawater Intrusion in a Coastal California Aquifer. U.S. Geological Survey Fact Sheet 125-96. https://pubs.usgs.gov/fs/1996/0125/report.pdf
_____. 1996b. Source, Movement, and Age of Ground Water in a Coastal California Aquifer. U.S.
Geological Survey Fact Sheet 126-96. https://pubs.usgs.gov/fs/1996/0126/report.pdf
Izbicki, J.A., Christensen, A.H., Newhouse, M.N., and Aiken, G.R. 2005. Inorganic, isotopic, and organic composition of high-chloride water from wells in a coastal southern California aquifer: Applied Geochemistry, v. 20, p. 1496–1517.
Kennedy/Jenks Consultants (KJC). 2011. Ventura River/San Antonio Creek Watershed Survey, 2010
Update. Prepared for City of San Buenaventura. July.
Kew, W.S. 1924. Geology and Oil Resources of a Part of Los Angeles and Ventura Counties, California. U.S. Geological Survey Bulletin 753. https://pubs.usgs.gov/bul/0753/report.pdf
Martin, J. 2014. Central Coast Groundwater: Seawater Intrusion and other Issues. Prepared for California Water Foundation. August 4.
https://www.water.ca.gov/LegacyFiles/waterplan/docs/cwpu2013/Final/vol4/groundwater/11Central_Coast_Groundwater_Seawater_Intrusion.pdf
Montrella, Joseph, and Belitz, Kenneth. 2009. Ground-water quality data in the Santa Clara River Valley study unit, 2007—Results from the California GAMA Program: U.S. Geological Survey Data Series 408, 84 p. http://pubs.usgs.gov/ds/408
Newton Geohydrology Consulting Services (Newton). 2016. Summary Review of Submittals to LARWQCB Investigative Order No. R4-2015-0450 and R4-2015-0464. Technical Memorandum to Citizens for Responsible Oil and Gas (CROG). Attachment A to CFROG (2016). October 5.
Ojai Basin Groundwater Management Agency (OBGMA). 2018. Groundwater Management Plan – 2017
Update, Draft. March 14. http://obgma.com/wp-content/uploads/2018/03/OBGMA-GMP-2018-Update-03-4-18.pdf
Port Hueneme. 2016. Consumer Confidence Report, 2016. https://www.ci.porthueneme.ca.us/DocumentCenter/View/1140
United Water Conservation District (UWCD). 2011. Santa Clara River Watershed Sanitary Survey Update.
Reporting Period: January 1, 2006 through December 31, 2010. January. https://www.unitedwater.org/images/stories/reports/WaterQuality/Sanitary_Survey_Update_2010_Final.pdf
_____. 2012. Hydrogeologic Assessment of the Mound Basin. Open-File Report 2012-01. May.
https://www.unitedwater.org/images/stories/reports/GW-ConditionsReports/2012/Mound_Basin_Assessment_Report_-_FINA_5-16-12.pdf
_____. 2016. 2014 and 2015 Piru and Fillmore Basins Biennial Groundwater Conditions Report. OpenFile Report 2016-01. June. https://www.unitedwater.org/images/stories/reports/GWConditions-Reports/2015/2014-2015%20Piru%20%20Fillmore%20basins%20Biennial%20GW%20Cond%20Rpt%20FINAL.pdf
_____. 2017. 2016 Santa Paula Basin Annual Report. UWCD Professional Paper 2017-02. Prepared for
Santa Paula Basin Technical Advisory Committee. September.
https://www.unitedwater.org/images/stories/reports/GW-ConditionsReports/2016/SPbasin2016AnnualReport_FinalDft_2017-09-28_Complete_ReducedFileSize.pdf
_____. 2018. Annual Investigation and Report of Groundwater Conditions within United Water
Conservation District. Groundwater Department. March.
https://www.unitedwater.org/images/stories/reports/GWConditionsReports/2018/2018%20Annual%20Investigation%20and%20Report%20of%20GW%20Conditions%
20within%20UWCD%20FINAL.pdf
_____. 2018. Oxnard-Hueneme Water Delivery System, 2017 Consumer Confidence Report. April.
https://www.unitedwater.org/images/stories/reports/WaterQuality/2017%20Consumer%
20Confidence%20Report%20FINAL.pdf
Ventura Water. 2017. 2017 Drinking Water Consumer Confidence Report.
https://www.cityofventura.ca.gov/DocumentCenter/View/8875/2017-Consumer-ConfidenceReport
Ventura County Resource Management Agency (VCRMA). 2018. Oil and Gas Program.
https://vcrma.org/oil-and-gas-program
Ventura County Watershed Protection District (VCWPD). 2006. Inventory of Public & Private Water
Purveyors in Ventura County. Water and Environmental Resources Division, Groundwater
Section. March. http://pwaportal.ventura.org/ESD/DIS/docs2/WAL%20Docs/2006-03_Inventory_Public_and_Private_Water_Purveyors-Ventura_County_2006.pdf
_____. 2016. 2015 Annual Report of Groundwater Conditions. September.
http://pwaportal.ventura.org/WPD/docs/GroundwaterResources/2015%20Annual%20Report%20Final%20-%20Reduced.pdf
Ventura River Watershed Council (VRWC). 2015. Ventura River Watershed Management Plan. March.
http://venturawatershed.org/the-watershed-plan
DISCLAIMER
The information, statements, statistics and commentary contained in this report have been prepared based on publicly available material and information. No opinion is expressed as to the accuracy or completeness, assumptions or any conclusions contained in the documents or information reviewed. This report is based on the understanding that the information provided or obtained is accurate and complete.
About the Authors
Thomas M. Johnson, PG, CHG is Principal Hydrogeologist of Thomas Johnson Associates. He is former President of the California Groundwater Resources Association, and provides water and environmental expert consulting services to public and industrial clients.
Eric M. Nichols, PE is Principal of Substrata LLC. He provides strategic consulting on soil and groundwater contamination and cleanup, and environmental issues related to petroleum production and distribution.
Caryl L. Walti, RG, CEM is Principal of CW Consulting. She provides water resource and environmental consulting services to private and industrial clients.
Say no to limiting oil production in Ventura County and yes to energy independence and jobs in Ventura County.