March 2018
Prepared For:
Californians for Energy Independence
Prepared By:
Capital Matrix Consulting
Brad Williams, the lead author of this report, joined Capitol Matrix Consulting (CMC) in 2011, after having served in various positions in California state government for 33 years. Mr. Williams served for over a decade as the chief economist for the Legislative Analyst’s Office, where he was considered one of the state’s top experts on the tax system, the California economy, and government revenues. He was recognized by the Wall Street Journal as the most accurate forecaster of the California economy in the 1990s, and has authored numerous studies related to taxation and the economic impacts of policy proposals. Immediately prior to joining CMC, Mr. Williams served as a consultant to the Assembly Appropriations Committee, where he advised Democratic leadership on proposed legislation relating to taxation, local government, labor, and banking.
Mike Genest founded Capitol Matrix Consulting (originally Genest Consulting) in 2010 after concluding a 32‑year career in state government, which culminated as Director of the California Department of Finance (DOF) under Governor Arnold Schwarzenegger. Prior to his four-year stint as the Governor’s chief fiscal policy advisor, Mr. Genest held top analytical and leadership positions in both the executive and legislative branches of government. These included Undersecretary of the Health and Human Services Agency, Staff Director of the Senate Republican Fiscal Office, Chief of Administration of the California Department of Corrections and Rehabilitation, and Director of the Social Services section of California’s Legislative Analyst’s Office.
The oil and gas production industry has been an important source of economic output, jobs and income in the Los Angeles basin for more than 100 years. It is a source of high-paying jobs in a range of professional and technical occupations in the region. It also accounts for 11 percent of total oil production in California – a state that currently imports over two-thirds of its oil from foreign sources in order to meet consumer demand.
Though the industry is highly regulated, there is growing interest among environmental groups in placing restrictions on well production in the region through the use of oil-well setback requirements – that is, a requirement that wells not be allowed to operate within a specified distance (often ranging from 500 feet to 2,500 feet) from homes or certain public places. In view of this interest, Capitol Matrix Consulting has been commissioned by Californians for Energy Independence to evaluate the employment, economic and tax revenue impacts that such setback requirements would have under two scenarios – one assuming the setbacks are adopted by Los Angeles City and the other assuming that the requirements are applied to all production in Los Angeles County (“County”).
Although this report focuses on the importance of oil and natural gas production to local employment, economic activity and government revenues, it is important to note that setbacks also restrict development surrounding the targeted activity. This report does not evaluate the additional effects of limiting development surrounding the thousands of operating oil and natural gas wells in the County.
Oil production. Onshore oil production in the County was 12 million barrels in 2016, of which 2.7 barrels were from wells located within Los Angeles City. County production taking place offshore was 9.4 million barrels. Los Angeles County is the second largest oil-producing region in the state, trailing only Kern County. Combined onshore and offshore production in Los Angeles County represents 11 percent of California’s total production.
Natural gas production. Total natural gas extracted in the County was 61 million cubic feet (MMcf) in 2016, or about 10.2 million barrels of oil equivalents (BOE). Gas extraction within Los Angeles City was 11 million cubic feet, or about 1.9 million BOE. Less than half of the County total, and only about 10 percent of the City total, represents new production that is sold on the market. A large share of gas extracted in the County is related underground operations of Southern California Gas (Sempra). Much of the remainder is gas that is produced in conjunction with oil extraction. While some of this “associated gas” is sold on the market, a significant share is also sold to utilities or is used internally for power and co-generation (which shows up in our analysis as a reduction in net producer costs). Because non-associated natural gas production in the County is so small, the focus of this analysis is on oil production-related impacts.
Workers employed by the industry. About 4,300 workers were directly employed in the oil and gas production industry in the County during 2016. Of this total, about 541 were working inside Los Angeles City. Another 1,900 employees within the County were working in closely-related crude oil pipeline construction and transportation industries. These oil and gas production and distribution jobs are:
In April 2017, Los Angeles City Council President Herb Wesson introduced a motion calling for a study analyzing the feasibility of a buffer zone or setback for wells located next to “sensitive land uses,” defined broadly in the motion as “homes, schools, hospitals, parks and public places.” Community activists have suggested a 2,500-foot buffer around all production wells in the City. In response to these concerns, the Los Angeles County Department of Public Health published an evaluation of the pubic health and safety risks associated with oil and gas production in the County in February 2018. In this study, the County reviewed setback ordinances adopted by other jurisdictions and found that these jurisdictions defined sensitive land use as “housing, schools, faith institutions and hospitals.” Based on this definition, we evaluated the economic and fiscal impacts that setback requirements would have on the Los Angeles City and Los Angeles County, taking into account both direct and multiplier effects.
Methodology and assumptions. In order to estimate the potential economic impacts of oil-well setback requirements, we first developed a baseline estimate of the industry’s contributions to the Los Angeles region in 2018 under current law, based on a variety of public and company-provided data. We then projected these contributions forward to 2025 based on assumptions about such factors as future crude oil prices, oil production, and production-related expenditures. The sources, methodology, and key assumptions underlying our estimates are discussed in Appendix 1.
Using estimates developed by Catalyst Environmental Solutions on the number of wells and associated production affected by specific setback proposals, we then estimated the corresponding reductions in economic activity relative to our baseline, assuming a 2020 implementation date for the setbacks.
Economic and tax contributions under existing law. Our specific annual average estimates for the 2020 through 2025 period are as follows:
These large effects are due to several factors, including: (1) the high wages paid by the industry, which are spent on goods and services and create strong multiplier effects in the region; (2) the presence of company headquarters, centralized purchasing, and logistical support operations in the County; (3) a large network of local suppliers; and (4) the large amount of expenditures made to these local
suppliers by producers to maintain production in the region’s mature oil fields.
Impacts of setback requirements on oil and gas production. In its two reports presented to Californians for Energy Independence in March 2018, Catalyst Environmental Solutions estimated that setback requirements would have major impacts on oil production in the Los Angeles region. If applied County-wide, a 500-foot setback would eliminate about one-quarter of combined onshore and offshore production in the County, and a 2,500-foot setback requirement would eliminate slightly over one-half of the combined total. The effects on Los Angeles City production would be even more pronounced. A 500-foot setback would eliminate 63 percent of production, and a 2,500-foot setback would eliminate 87 percent of oil production in the City.
Corresponding economic and fiscal impacts. These impacts would be substantial. As shown in Figure Exec-1, even a 500-foot setback imposed by Los Angeles City would result in losses of $255 million in economic output, 890 jobs (many of them high paying), $88 million in labor income, and $22 million in state and local taxes. Adoption of a 2,500-foot setback would result in job losses of 1,221, labor income losses of $122 million, and state and local tax reductions of $29 million.
Figure Exec-1
Economic and Fiscal Impacts of Setback Ordinances Imposed By Los Angeles City – Direct and Multiplier Effects (Annual Average Reductions – 2020 to 2025)
| Setback Distance | |||
|---|---|---|---|
| Loss In: | 500 Foot | 1,500 Foot | 2,500 Foot |
| Oil production (%) | 63% | 86% | 87% |
| Economic Output ($ Millions) | $255 | $340 | $344 |
| Employment | 890 | 1,210 | 1,221 |
| Labor Income ($ Millions) | $88 | $120 | $122 |
| State/Local Taxes ($ Millions) | $22 | $28 | $29 |
The impacts would be much larger if the setbacks were applied to all wells in the County. As indicated in Figure Exec-2, job losses directly and indirectly related to oil and gas production would range from 2,665 jobs (under a 500-foot setback) to 5,685 jobs (under a 2,500-foot setback). Losses in economic output would range up to $1.6 billion, and state and local tax payments would decline as much as $131 million. Another 2,000 jobs related to downstream distributive industries, such as oil-pipeline construction and transportation, would also be at risk.
Under this scenario, economic losses within Los Angeles City would be greater than what is shown in Figure Exec-1 (which displayed the impacts of setbacks adopted by just Los Angeles City). Specifically, the City would face losses of up to 1,790 jobs, $460 million in economic output, and $38 million in state and local taxes. The greater impacts relative to the City-only adoption scenario occur because City businesses and residents would be negatively affected by cutbacks of oil production within the City’s boundaries as well as the loss of “cross-border” purchases by producers and their employees that are working in other oil fields in the County impacted by the setbacks.
Figure Exec-2 Economic and Fiscal Impacts of Setback Ordinances Imposed County-wide Direct and Multiplier Effects (Average Annual Losses – 2020 to 2025)
| Setback Distance | |||
|---|---|---|---|
| Loss In: | 500 Foot | 1,500 Foot | 2,500 Foot |
| Country-wide impacts: | |||
| Onshore & offshore oil production (%) | 24% | 37% | 52% |
| Economic Output ($ Millions) | $740 | $1,130 | $1,580 |
| Employment | 2,665 | 4,070 | 5,685 |
| Labor Income ($ Millions) | $235 | $360 | $495 |
| State/Local Taxes ($ Millions) | $60 | $94 | $131 |
| Los Angeles City impacts: | |||
| Oil production (%) | 63% | 86% | 87% |
| Economic Output ($ Millions) | $295 | $405 | $460 |
| Employment | 1,100 | 1,550 | 1,790 |
| Labor Income ($ Millions) | $102 | $140 | $159 |
| State/Local Taxes ($ Millions) | $29 | $36 | $38 |
Potential loss in economic value of oil and gas fields in Los Angeles County. Finally, we estimate the present discounted value of current and future earnings from the extraction of oil from fields in Los Angeles County is between $1.2 billion and $3.4 billion, depending mainly on the path of future crude oil prices. By banning a potentially large share of future oil extraction, setback requirements adopted throughout the County would sharply diminish the value of these reserves. This would result in a major loss in value to oil producers and mineral rights owners in the County (including the City of Long Beach and the State of California). The restrictions could also put the City and the County at risk of major liability associated with subsequent “takings” lawsuits by oil companies and mineral rights owners seeking recovery under the United States and California Constitutions for lost future profits from extraction of oil and gas from these reserves.
Oil production has a long history in the Los Angeles basin. In the early 20th century, Los Angeles County was one of the largest producers in the nation, and even today oil production exceeds over 21 billion barrels. Oil production in the County accounts for about 11 percent of California’s total. The number of employees and wages in the region is proportionally greater than its share of annual California production. This is because Los Angeles County is home to the headquarters of two major oil producers, as well as centralized purchasing and logistical operations that are strategically located in the region to support oil and gas operations throughout California.
Oil and gas production is highly regulated by multiple state and federal agencies, including the California State Department of Conservation, Division of Oil, Gas & Geothermal Resources (DOGGR). The industry is an important source of high paying, middle-class jobs – which have otherwise been declining in Los Angeles County due to a 40 percent reduction in its manufacturing sector since the year 2000. Furthermore, oil and gas production has strong multiplier effects, which boost jobs and income in a wide range of businesses in the County.
Despite these positive factors, there is a growing interest among environmental groups to impose setback requirements for oil wells in the County, thereby sharply curtailing production in the region. Such requirements would jeopardize billions in economic output and thousands of jobs associated with the oil and gas production industry. Capitol Matrix Consulting was commissioned by Californians for Energy Independence to estimate the economic and fiscal consequences of setback requirements in both Los Angeles City and Los Angeles County.
Our analysis focuses on the impact of setback requirements on oil and gas producers, their suppliers, and those involved in transporting and selling the product to refineries. It does not address the potentially substantial impacts that setback requirements could also have on the future development of land located within the newly created buffer zones.
Moreover, California imports over two-thirds of its oil and 90% of its natural gas. Because most oil and gas produced in Los Angeles County is processed and sold in in California, significant reductions in oil production in the region caused by setbacks will have significant implications for the California’s dependence on crude oil from out-of-state sources. Much of this imported oil is produced in foreign countries under less stringent safety, labor, human rights and environmental standards. Over time, the loss of domestic production would put the State at greater risk of foreign supply disruptions and make the State vulnerable to higher petroleum prices.
In the following sections, we provide background information on the industry operating in Los Angeles County and Los Angeles City, including the major oil fields and producers, the number of workers and types of occupations, and the average wages paid by the industry compared to the rest of the economy. We then present our estimates of (1) the industry’s economic and fiscal contributions to Los Angeles City and Los Angeles County under existing law, and (2) the impacts that specific setback ordinances would have on these contributions.
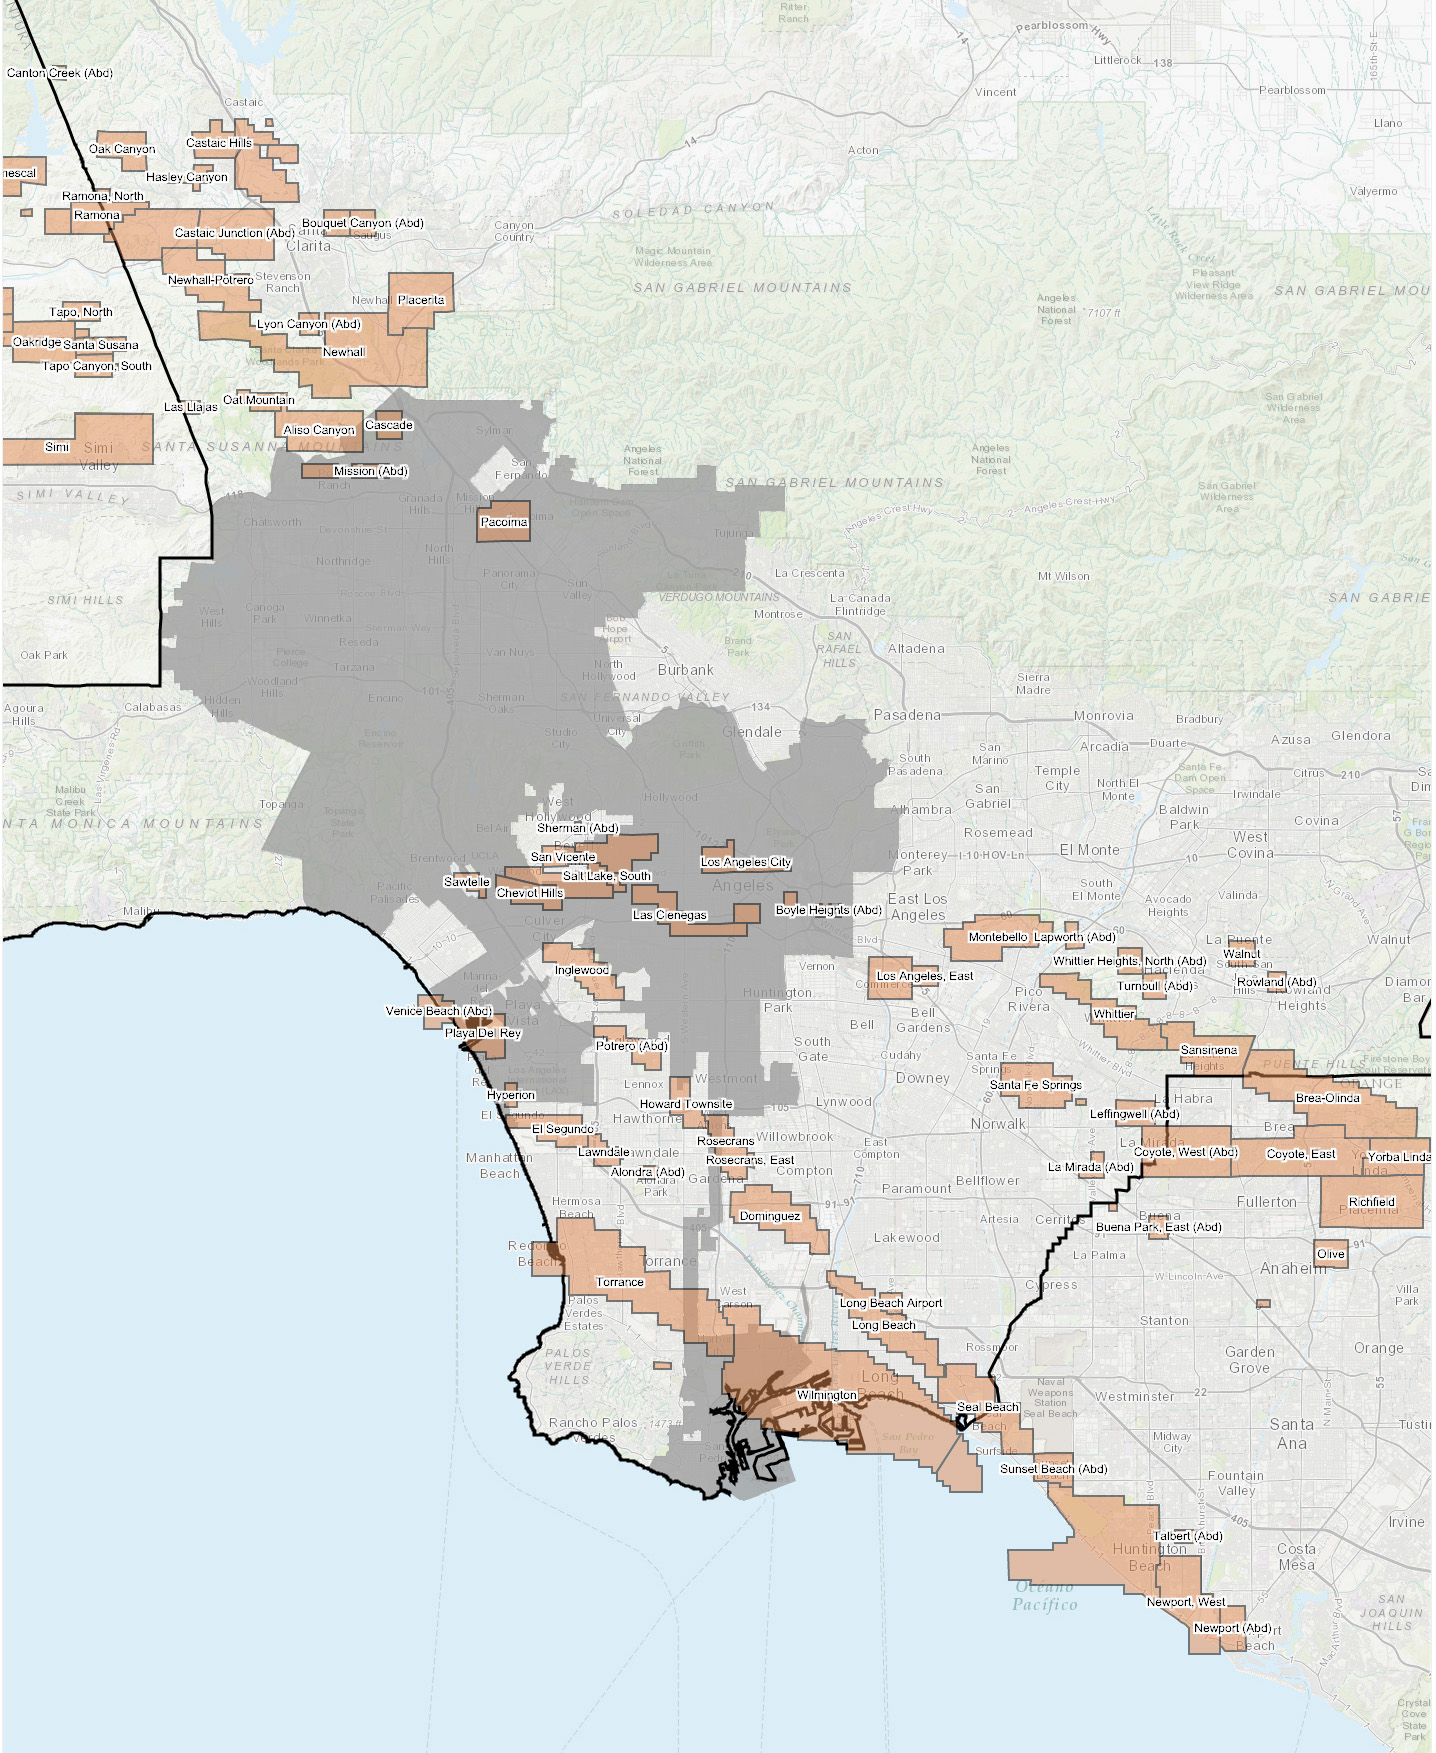
Oil production has been a major part of Los Angeles County’s economy for more than 100 years. The first commercially successful discoveries were the Pico Canyon Oil Field in 1876 and Los Angeles City Oil Field in 1892. These were followed by discoveries of additional major fields through the early twentieth century, mainly between 1920 and 1932. Larger fields include Huntington Beach in 1920, Long Beach and Santa Fe Springs in 1921, Torrance in 1922, Dominguez in 1923, Inglewood in 1924, and Wilmington in 1932. New discoveries, mostly in smaller fields, continued intermittently through the 1950s before trailing off in the 1960s. The most recent discovery in the County was in 1970.1 Currently, there are 44 active oil fields in the County. These are shown in Figure 1.2
Given that most fields have been in production for over 60 years, annual output is well past peak levels. However, output from these fields has been maintained through enhanced production techniques, mostly water flooding and steam injection. The incremental volume of oil associated with these enhanced recovery techniques accounts for over three-quarters of total production in the County.3 The high level of investments needed to maintain production translates into considerable economic activity in the County, particularly during periods of high oil prices when companies have internal resources available to invest in new wells and other field improvements.
In 2016, total oil production in Los Angeles County was 21.3 million barrels. About 12.0 million of this total was from onshore wells and 9.3 million barrels was from offshore wells. About 2.7 million barrels were extracted within Los Angeles City. Total gas extraction in the County was 61 million cubic feet in 2016, or about 10.2 million of barrels of oil equivalent (BOE). About 11.9 million cubic feet (2 million BOE) came from wells located in the City. About 45 percent of the County-wide total and over 90 percent of the City total are related to underground storage operations of Southern California Gas.4 Much of the remaining gas is produced in conjunction with oil well operations. Only a portion of this “associated gas” is sold on the market (the rest is used internally by producers for power and cyclic steam generation). Because most gas production in the County is either related to storage operations or is associated gas that is partly reused by producers in their oil well operations, our focus in this report will be primarily on oil production.
Figure 1
Oil Fields in Los Angeles City (Shaded Area) and Los Angeles County
In 2016, onshore oil production in Los Angeles County fields totaled 12 million barrels and offshore production totaled slightly over 9 million barrels. By far, the largest source of both onshore and offshore oil production is the Wilmington oil field (See Figure 2), which accounts for over 60 percent of oil production in the County. Offshore portions lie under Long Beach Harbor and San Pedro Bay, with much of the oil accessed through the THUMS artificial islands in San Pedro Bay. Onshore production is from wells located in and around the Port of Los Angeles and the City of Long Beach. Wilmington is the third largest field in the U.S. in terms of cumulative oil production and, after 85 years of production, still remains the fifth largest producing field in California. Other fields with more than 500,000 barrels of annual production include Inglewood (which lies under the Cities of Inglewood and Culver City), Long Beach, Santa Fe Springs, Placerita, and Beverly Hills.
Figure 2
Top Oil Fields in the Los Angeles Basin (2016)
| Oil Field | Oil Produced (Thousands of Barrels) |
Gas Produced (Thousands of BOE) |
|---|---|---|
| Los Angeles County (a): | ||
| Onshore: | ||
| Wilmington Onshore | 3,563 | 170 |
| Inglewood | 2,087 | 159 |
| Long Beach | 1,451 | 84 |
| Santa Fe Springs | 877 | 37 |
| Placerita | 609 | — |
| Beverly Hills | 594 | 117 |
| Montebello | 412 | 60 |
| Torrance | 334 | 11 |
| Seal Beach (a) | 237 | 40 |
| Las Cienegas | 227 | 36 |
| San Vicente | 217 | 36 |
| Offshore: | ||
| Wilmington Offshore | 9,009 | 540 |
| Belmont Offshore (b) | 319 | 20 |
| Los Angeles City (b): | ||
| Wilmington Onshore | 1,132 | 30 |
| Beverly Hills | 468 | 93 |
| Las Cienegas | 227 | 36 |
| San Vicente | 217 | 36 |
| Torrance | 161 | 11 |
| Cascade | 132 | 33 |
|
(a) For oil fields crossing County borders, represents portion extracted within the County. (b) For oil fields crossing City borders, represents portion extracted within the City. |
||
Los Angeles City. Oil production within Los Angeles City comes primarily from six fields located fully or partly within its boundaries. About 40 percent of the total is from onshore portions of the Wilmington Field, pumped by wells located in and around the Port of Los Angeles. Other significant sources of oil are the Las Cienegas, San Vincente, and Cascade fields, as well as portions of the Beverly Hills and Torrance fields.
Los Angeles County. There are about 120 oil and gas producers in Los Angeles County with at least one active or new well. The top six producers, shown in Figure 3, account for about 90 percent of total production in the County. The largest is California Resources Corporation (CRC), which accounts for about one-third of onshore production and virtually all of the offshore production in the region. It operates in eight fields in the Los Angeles basin, the largest of which is the Wilmington Field. CRC operations in Los Angeles County include THUMS Long Beach Company, which consists of the four oil production islands in San Pedro Bay. These islands are owned by the City of Long Beach and are used to extract oil from offshore portions of the Wilmington Field. CRC also owns Tidelands, which operates the West Wilmington Field for the City of Long Beach and the State of California.
Figure 3
Top Oil Producers in 2016
| Producer | Total Barrels (Thousands of Barrels) |
|---|---|
| Los Angeles County | |
| Onshore: | |
| California Resources Corporation | 3,685 |
| Sentinel Peak Resources | 3,312 |
| Signal Hill Petroleum | 1,233 |
| Breitburn Energy Partners, LP | 1,166 |
| Warren E&P | 971 |
| Berry Petroleum | 609 |
| Offshore: | |
| California Resources Corporation | 9,328 |
| Los Angeles City | |
| Sentinel Peak Resources | 838 |
| Warren E&P | 827 |
| California Resources Corporation | 297 |
| DCOR | 132 |
| Pacific Coast Energy Company | 113 |
| Brea Canon | 72 |
Other large producers in the County include: Sentinel Peak Resources, which is the sole operator in the Inglewood Field and also has operations in the Las Cienegas, Montebello, Salt Lake, Salt Lake South, and San Vicente fields; Signal Hill Petroleum, which has significant operations in Long Beach and Seal Beach fields; Breitburn Energy Partners, LP, which has operations in the Santa Fe Springs, Sawtelle, and Rosecrans fields; and Warren E&P, which operates onshore portions of the Wilmington Field.
Los Angeles City. There were about 30 producers operating in Los Angeles City in 2016. About 85 percent of total oil production came from the top six companies shown in Figure 3. These include: Sentinel Peak Resources (with production in Beverly Hills, Las Cienegas, and San Vincente fields); Warren E&P (Wilmington Field), California Resources (primarily its Tidelands operations in Wilmington Field); DCOR (Cascade Field), and Pacific Coast Energy Company (Beverly Hills Field).5
5.Source: California Department of Conservation, Division of Oil, Gas, and Geothermal Resources – Well Search.
https://secure.conservation.ca.gov/WellSearch88.
Oil production is influenced by both geological factors and economic factors. As indicated earlier, the oil fields in Los Angeles County have been in production for many years, and the natural tendency is for production from oil fields to fall as the oil reserves underlying these fields are depleted. The downward trend halted in 2010 and production trended slightly upward between 2010 and 2014 (see Figure 4). This period was characterized by sharp increases in oil prices, which provided companies with internal resources to invest in new wells, restoration of marginal wells, and in improved/enhanced oil recovery (EOR) systems. As one example of the magnitude of these investments, 10(k) filings from California Resources Corporation show that the Company invested $466 million (or more than $30 per barrel of oil produced) in water flooding operations in the Los Angeles Basin in 2014. More recently, falling oil prices have led to less investment in new wells and field operations, the idling of marginal wells, and a decline in production. Prices have recovered to over $50 per barrel as of late 2017, and assuming the upward movement continues, we would expect to see a corresponding rise in oil field investments and a stabilization of oil production over the next several years.
Figure 4
Los Angeles County Annual Onshore/Offshore Oil Production History
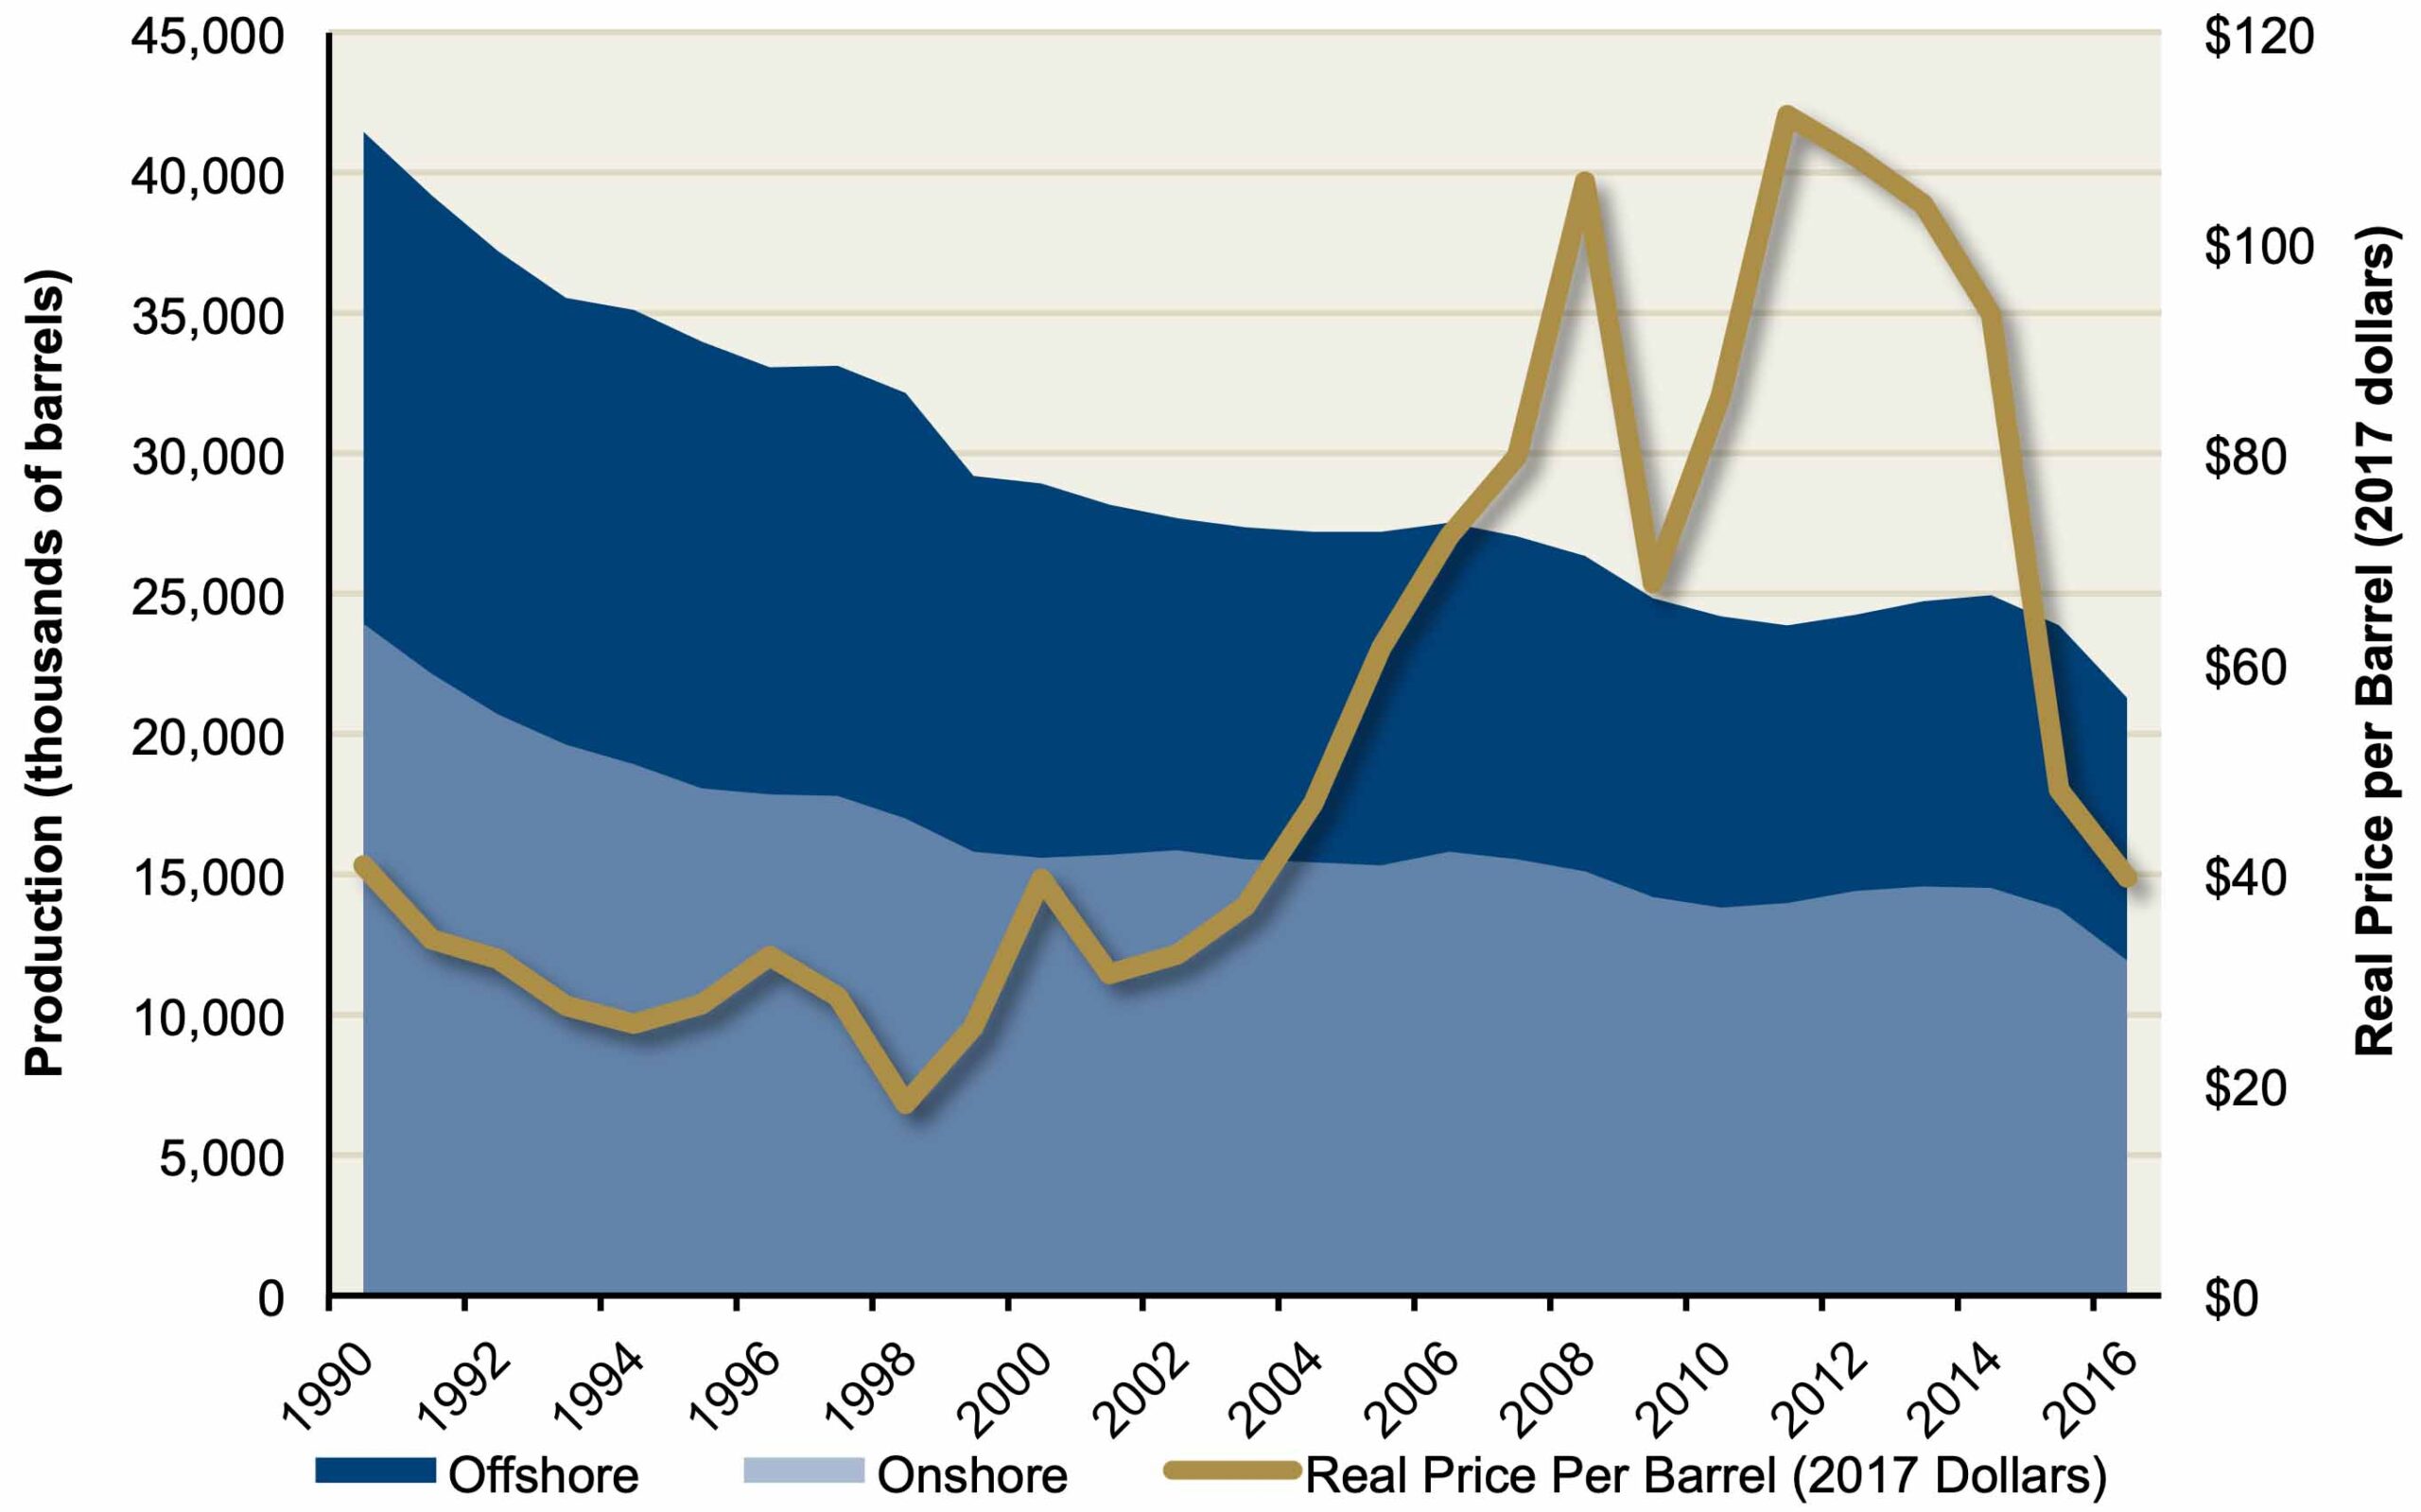
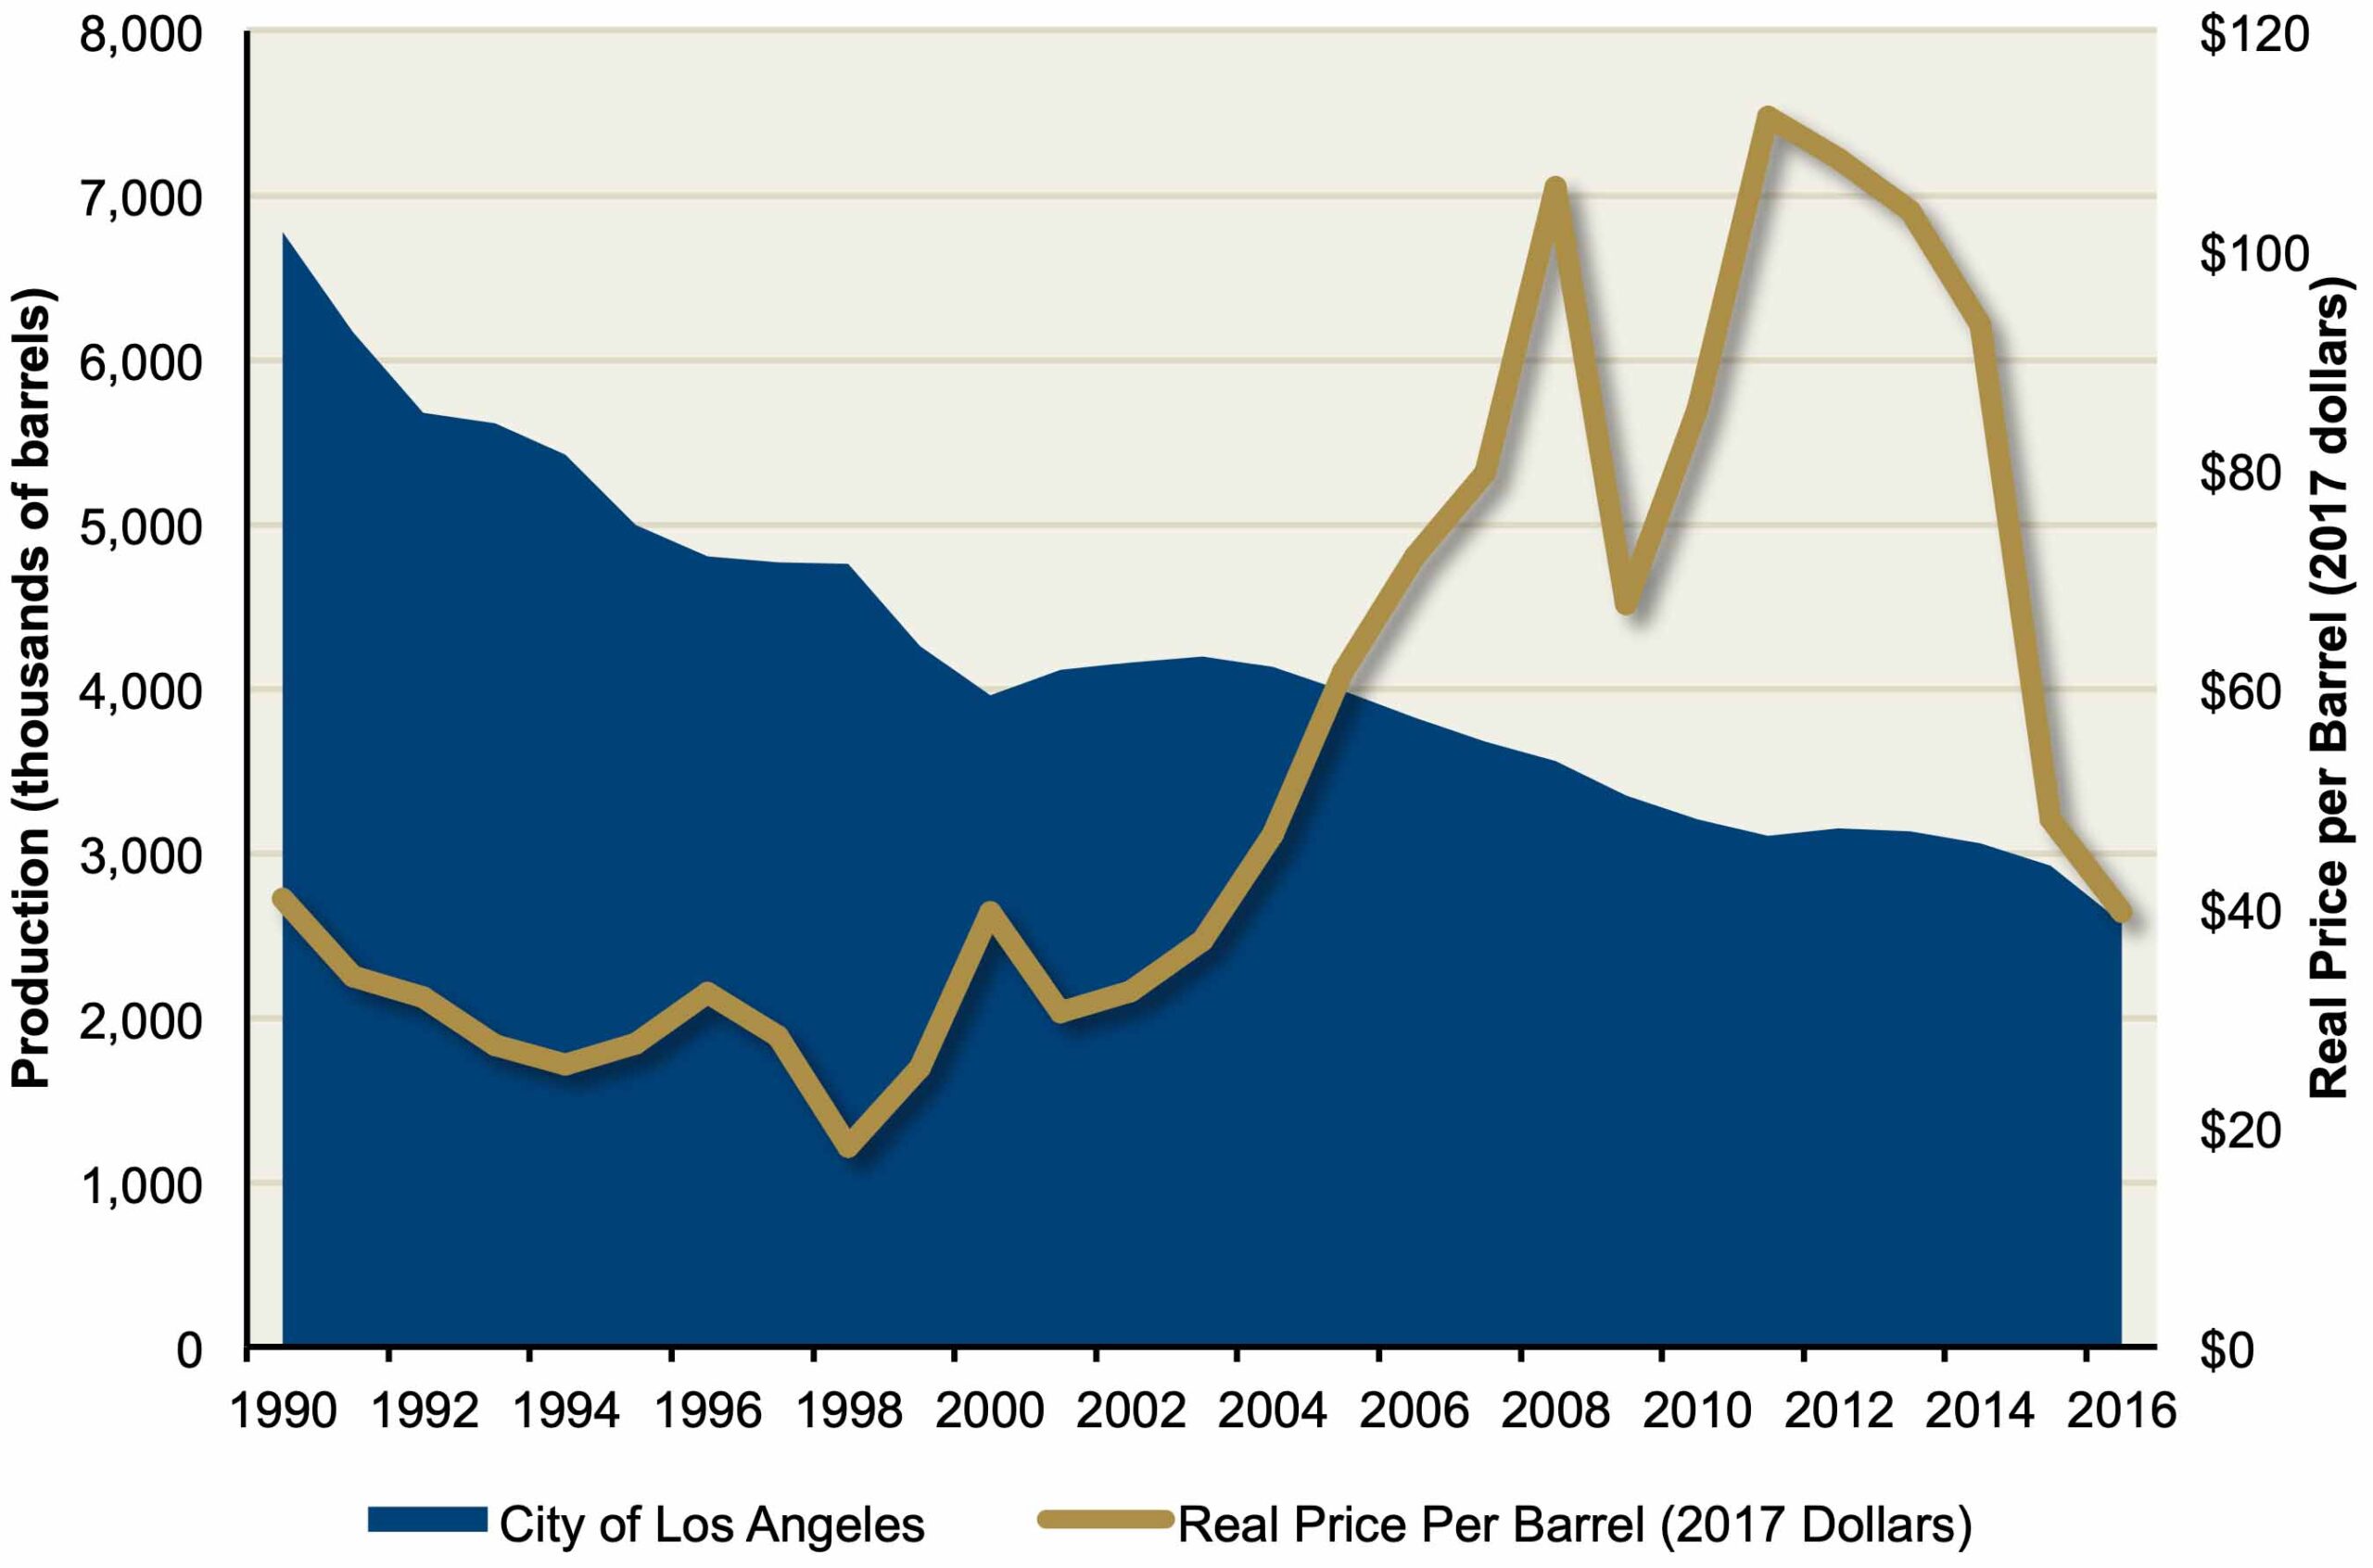
Figure 5 shows historical production from oil fields located wholly or partly in Los Angeles City boundaries. As with the County, City production has been on a long- term downward trend since the mid-1980s. The decline was suspended for a few years in the early 2000s and again between 2011 and 2014. In both cases, high oil prices enabled producers to make investments in new wells and other field improvements.
Figure 5
Oil Production and Prices – Los Angeles City
About 4,300 workers were directly employed in the oil and gas production industry in Los Angeles County during 2016 (the most recent year for which detailed employment totals are available). These employees were paid a combined total of $466 million in wages. As shown in Figure 6, the employment total includes about 2,079 workers in oil extraction (mostly with the major oil producers), 49 workers employed in companies providing drilling services, and 1,095 workers in companies (or divisions of companies) providing other support services to the oil producers. These other support services include surveying, excavation, cleaning and maintenance of wells, and operation of field gathering lines. The oil and gas production total also includes about 1,072 self-employed independent contractors, mostly providing field support services.
In addition to oil production-related jobs, there were 1,583 workers involved in crude oil pipeline construction and 319 employees in pipeline transportation industries in 2016. These jobs are primarily related to distribution of crude oil from producers to refineries and (in the case of transportation jobs) movement of refined petroleum products from refineries to downstream storage facilities. Many of them are dependent on local oil production activity (though some work on lines carrying oil from other regions to refineries). Addition of these jobs brings the total number of employees in the oil extraction and related industries to nearly 6,200, and total wages to $643 million.
Los Angeles City oil and gas operations. Figure 6 also shows that there were 541 workers oil and gas industry establishments operating in the City in 2016. These employees were paid a combined total of $77 million, which works out to an average annual wage of $143,000. The high rate partly reflects the presence of the California Resources Corporation and Breitburn Energy Partners headquarters in the City. An additional 112 employees were employed in pipeline construction industries in the City.
Average wages in the oil production industry are quite high. The combined County-wide average for all oil and gas-related jobs shown in Figure 6 is over $100,000, and the oil and gas extraction segment has an average wage of over $160,000. The extraordinarily high average wage in this segment partly reflects high wages paid by oil producers generally, but also is due to the significant number of well-paid jobs in headquarter, centralized purchasing, and logistical operations in the County.
Figure 6
Employment and Wages in the Oil and Gas Industry – Los Angeles County and Los Angeles City (2016)
| Oil and Gas Industries | Employment | Annual Wages ($ Millions) |
Average Annual Wage |
|---|---|---|---|
| Los Angeles County | |||
| Extraction | 2,079 | $334 | $160,813 |
| Support Activities: | |||
| Drilling | 49 | $5 | 97,980 |
| Other | 1,095 | 89 | 81,151 |
| Total employees, extraction & support | 3,223 | 428 | 132,793 |
| Self-employed independent contractors | 1,072 | $38 | 35,457 |
| Total, employees and contractors | 4,295 | $466 | $108,498 |
| Related industries: | |||
| Pipelines construction – Crude Oil | 1,583 | $138 | $87,440 |
| Pipeline transportation – Oil and Gas | 319 | 39 | 120,856 |
| Grand total | 6,197 | $643 | $103,755 |
| Los Angeles City | |||
| Extraction | 363 | $67.0 | $184,092 |
| Support Activities: | |||
| Drilling | 12 | 1.0 | 87,421 |
| Other | 72 | 6.2 | 86,792 |
| Total employees, extraction & support | 447 | $74.1 | $165,824 |
| Self-employed independent contractors | 94 | 3.3 | 35,462 |
| Total, employees & contractors | 541 | $77.4 | $143,259 |
| Related Industry: | |||
| Crude oil pipeline construction | 112 | $10.2 | $90,463 |
| Grand total | 653 | $87.6 | $134,165 |
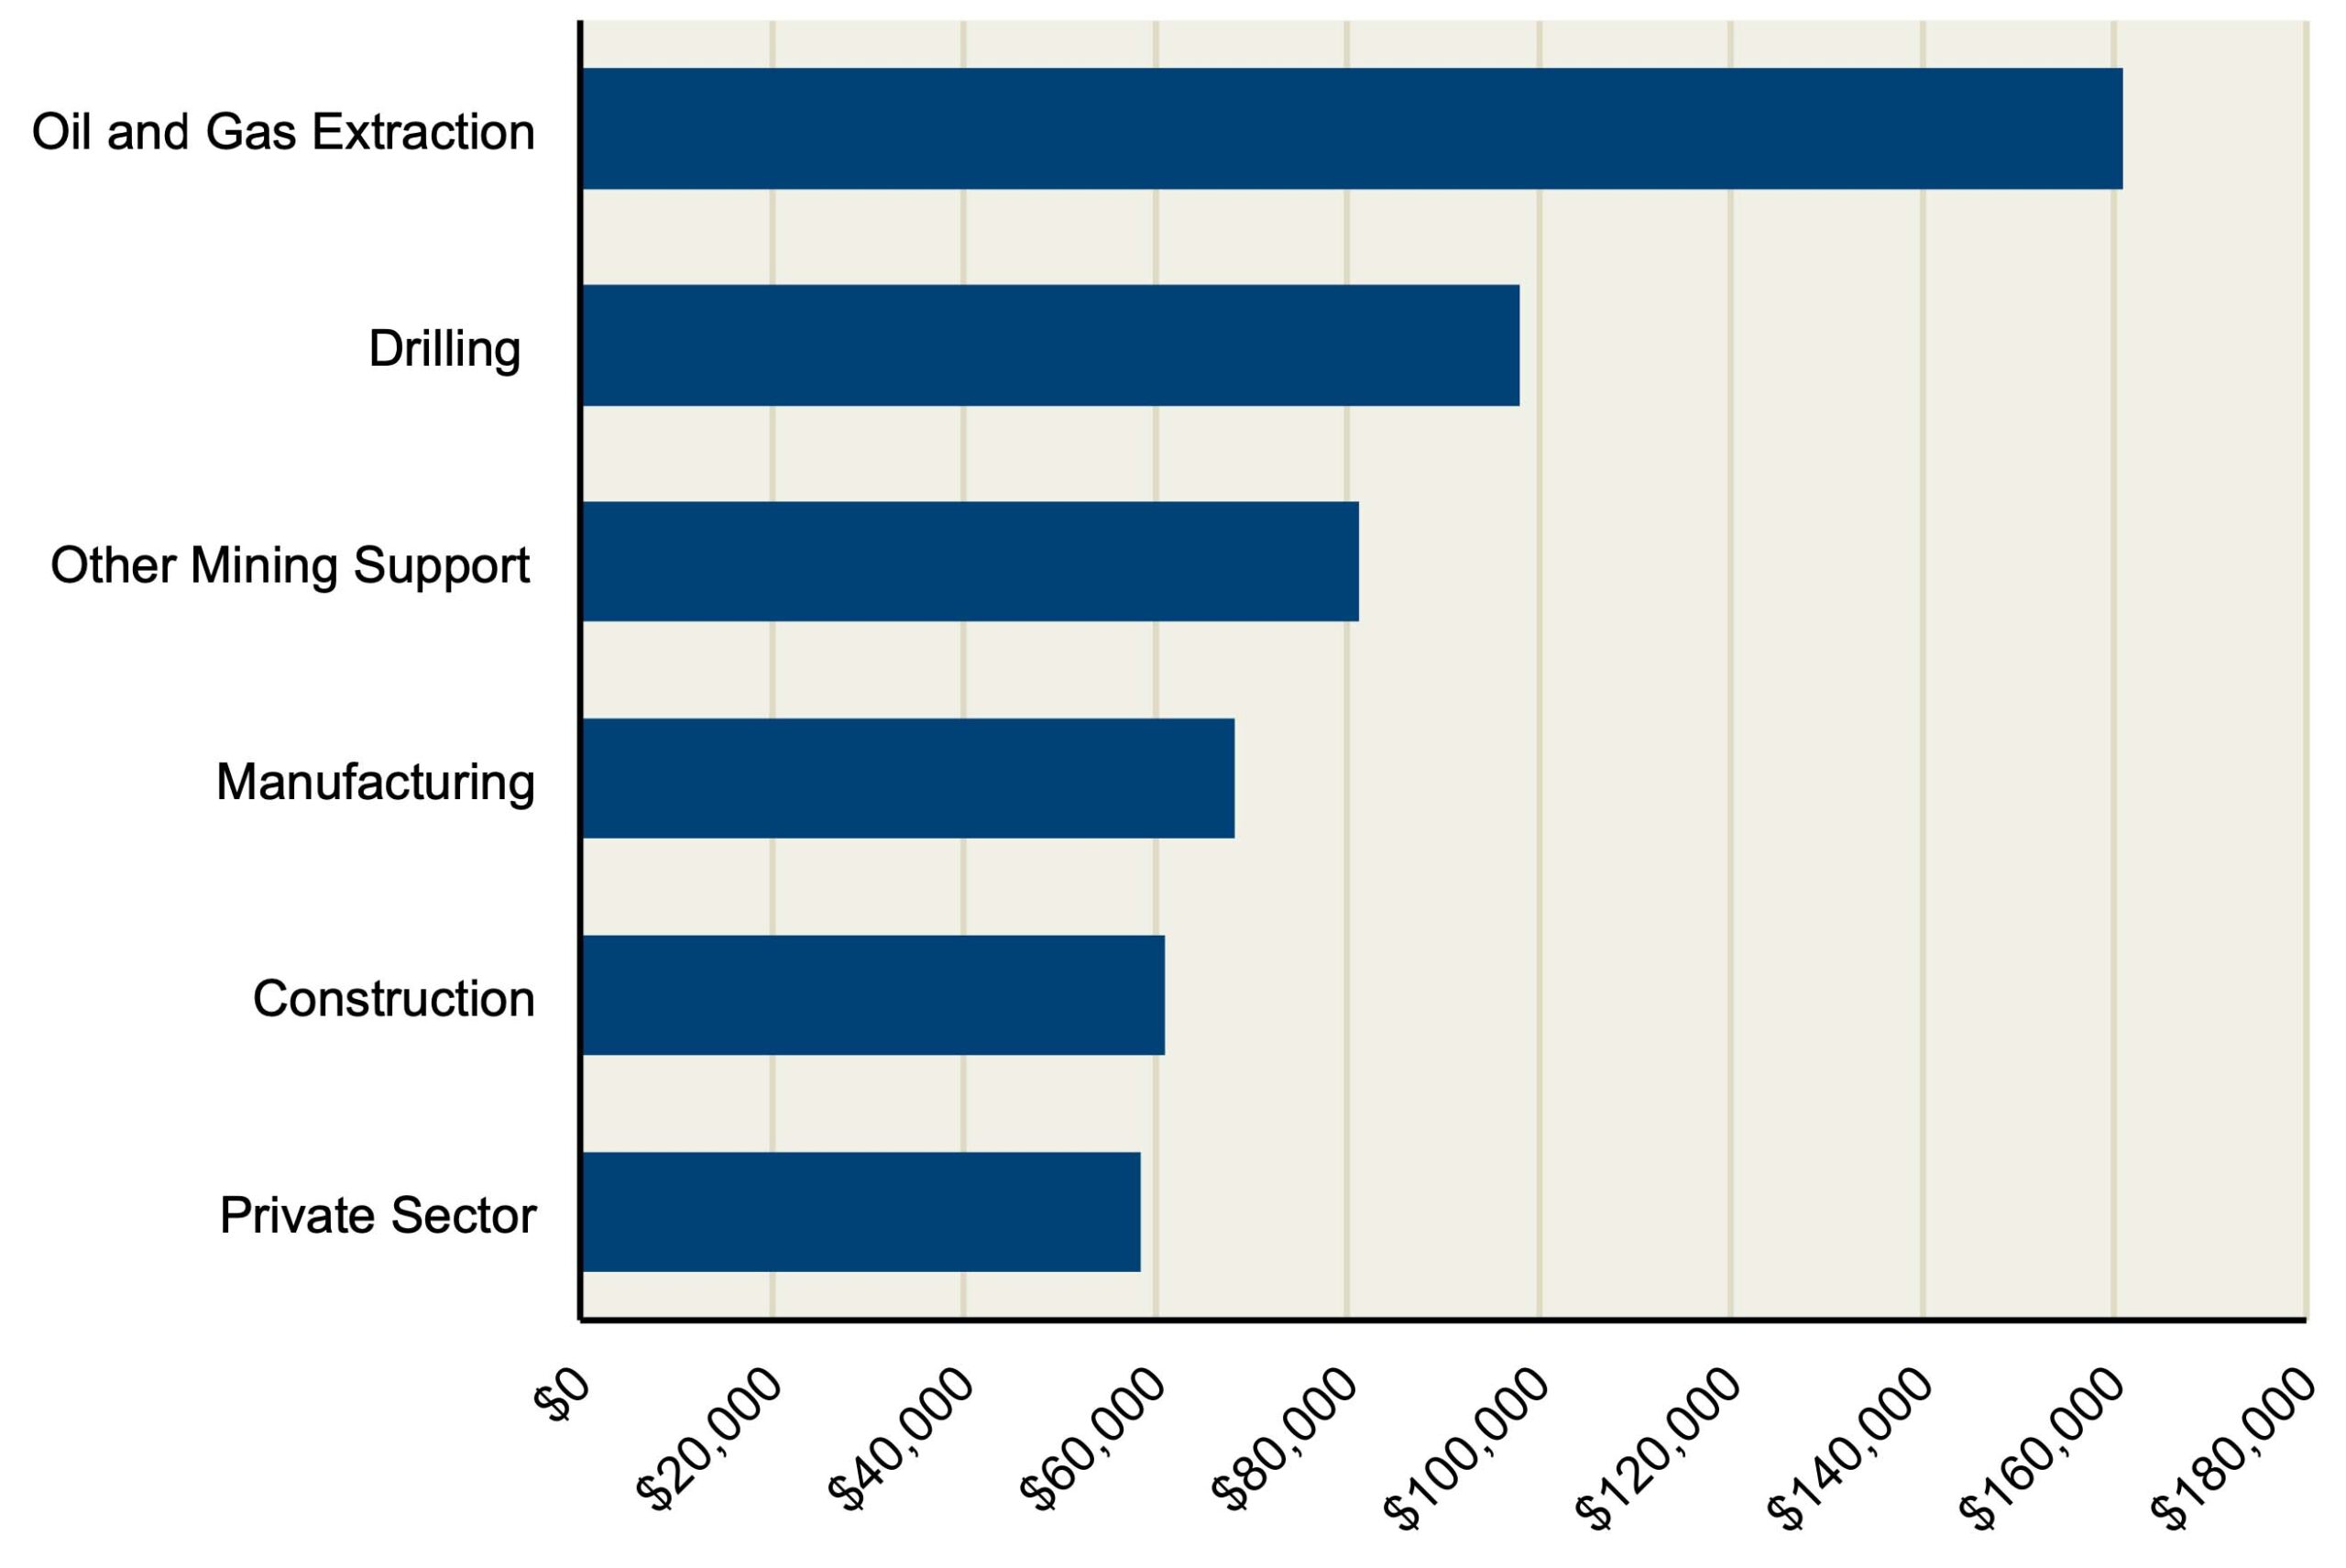
As indicated in Figure 7, pay rates for each of the oil and gas industry segments are well above the economy-wide private sector average of $58,000 per year. They are also well above other industries having large numbers of blue-collar jobs, such as manufacturing and construction.6
Figure 7
Los Angeles County Average Annual Wage by Industry in 2016
6 Employment and wage data is from the Quarterly Census of Employment and Wages, California Employment Development Department. http://www.labormarketinfo.edd.ca.gov/qcew/cew-select.asp. Field estimates of self-employed independent contractors from the U.S. Census Bureau, Non-employer statistics. https://www.census.gov/programs- surveys/nonemployer-statistics.html.
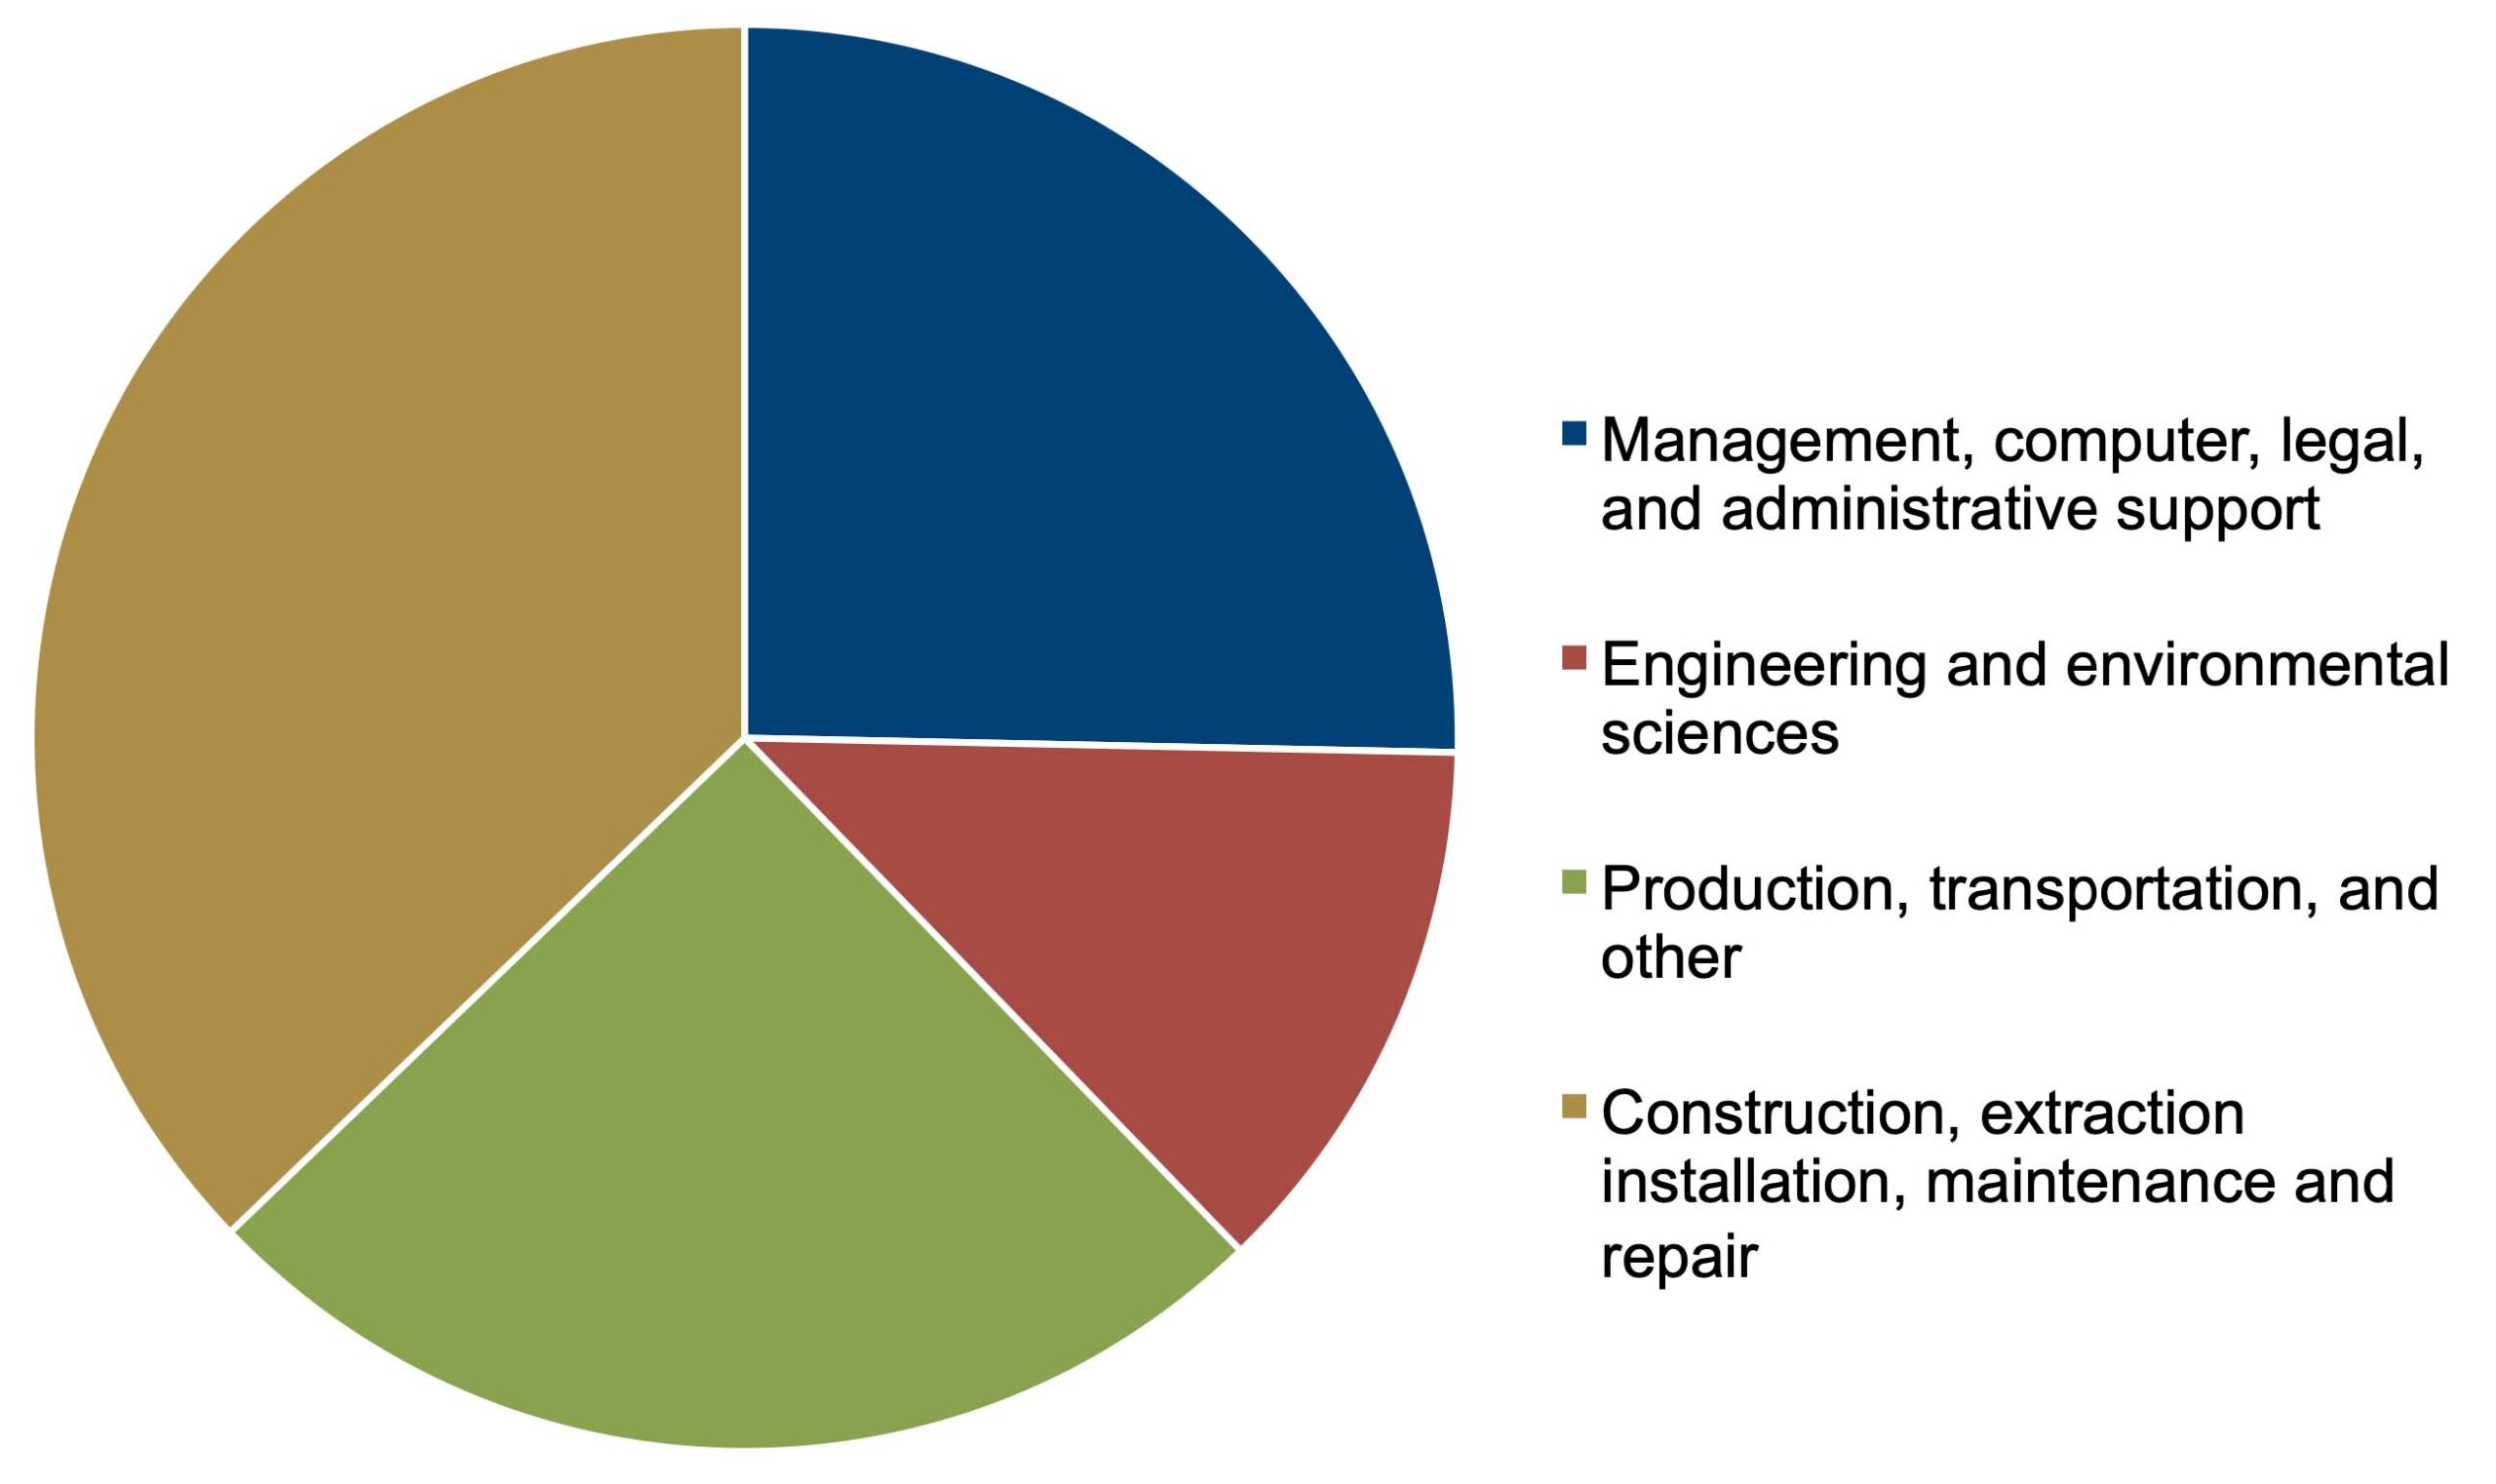
The oil and gas production and support industries employ a workforce with a diverse set of skills and educational backgrounds. As shown in Figure 8, 38 percent of total jobs in the production and support industries are in management and professional occupations, and the remaining 62 percent are (mostly) blue-collar jobs in construction, extraction, installation, maintenance, repair, and transportation occupations.7
Figure 8
Occupation Breakout of Oil and Gas Production-Related Industries
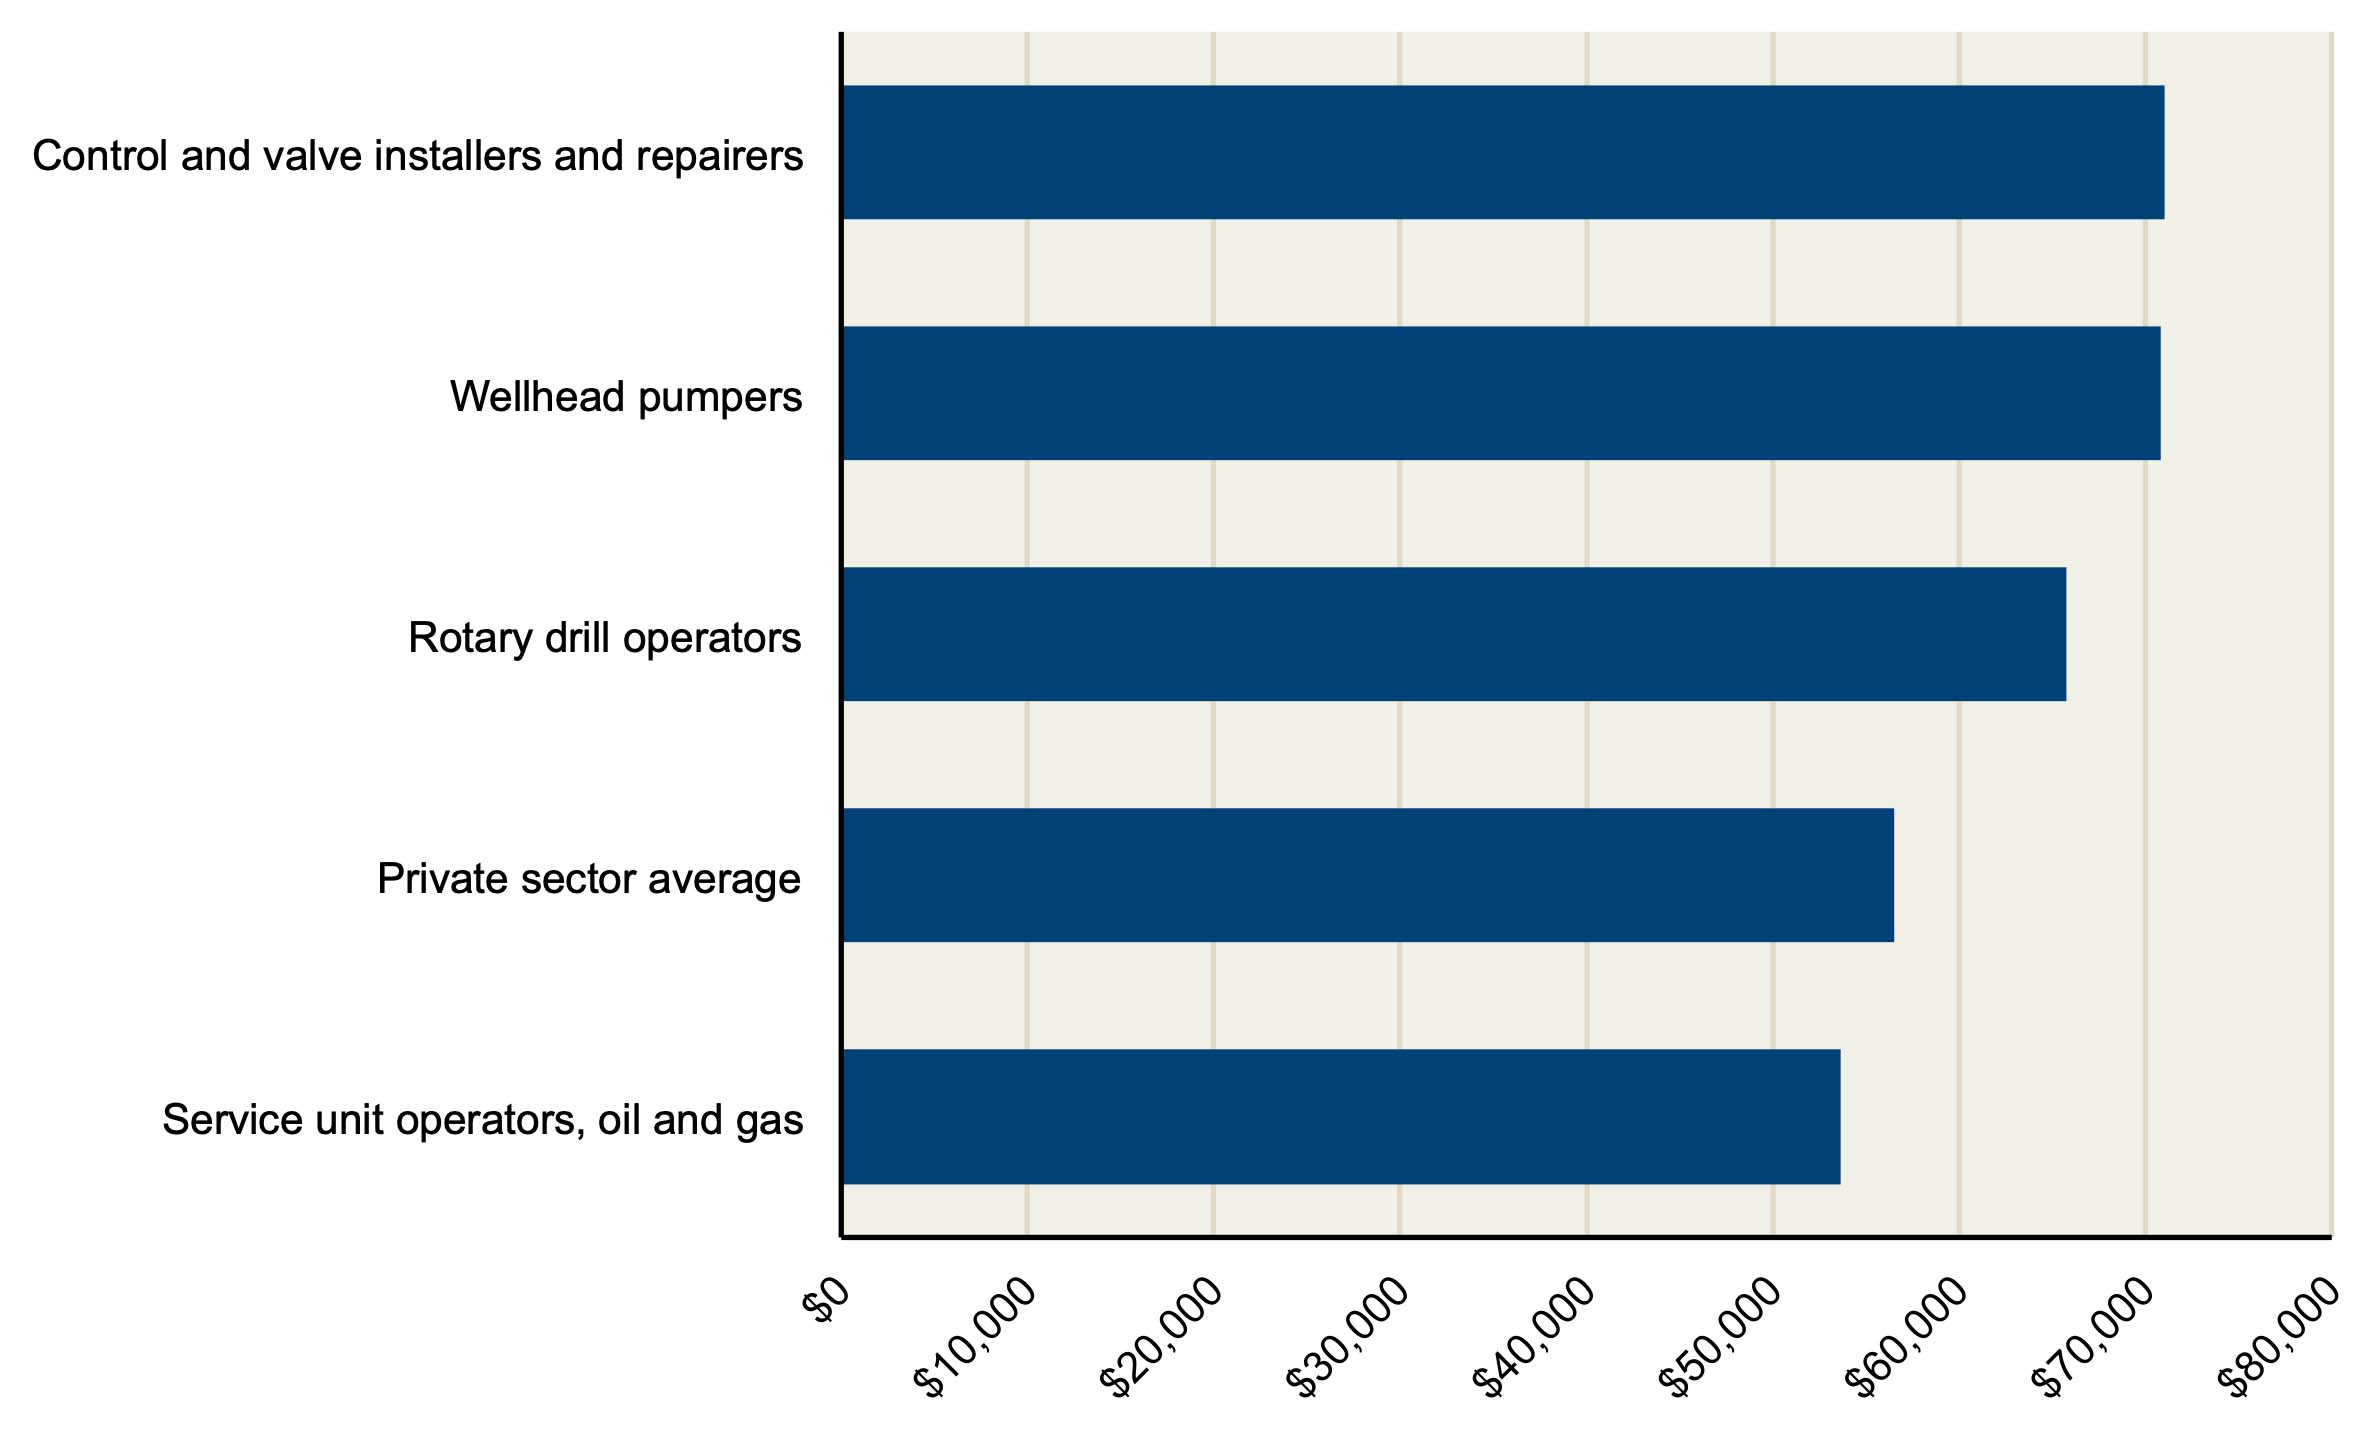
The industry is characterized by high wages paid to both professional and technical occupations. For example, average pay for petroleum engineers is $140,000 per year, which compares favorably to average wage rates for aerospace engineers ($131,000), biomedical engineers ($98,000), electrical engineers ($113,000), and civil engineers ($110,000). Equally important, however, is that oil and gas production industry pay rates for blue-collar occupations such as rotary drill operators and wellhead pumpers also compare favorably to other private sector jobs in the County (see Figure 9).8
7 Source: U.S. Department of Labor, Bureau of Labor Statistics Industry-Occupation Data Matrix. https://www.bls.gov/emp/ep_table_109.htm
8 Source: “Occupational Employment (May 2016) and Wage (2017 – 1st Quarter) Data. Occupational Employment Statistics (OES) Survey Results.”
Los Angeles, Long Beach, Glendale Metropolitan Division, Los Angeles County. Released June 2017. http://www.labormarketinfo.edd.ca.gov/data/oes-employment-and-wages.html#OES
Figure 9
Average Pay, Selected Blue-Collar Jobs in Oil and Gas Extraction and Support Industries, Los Angeles County (First Quarter 2017)
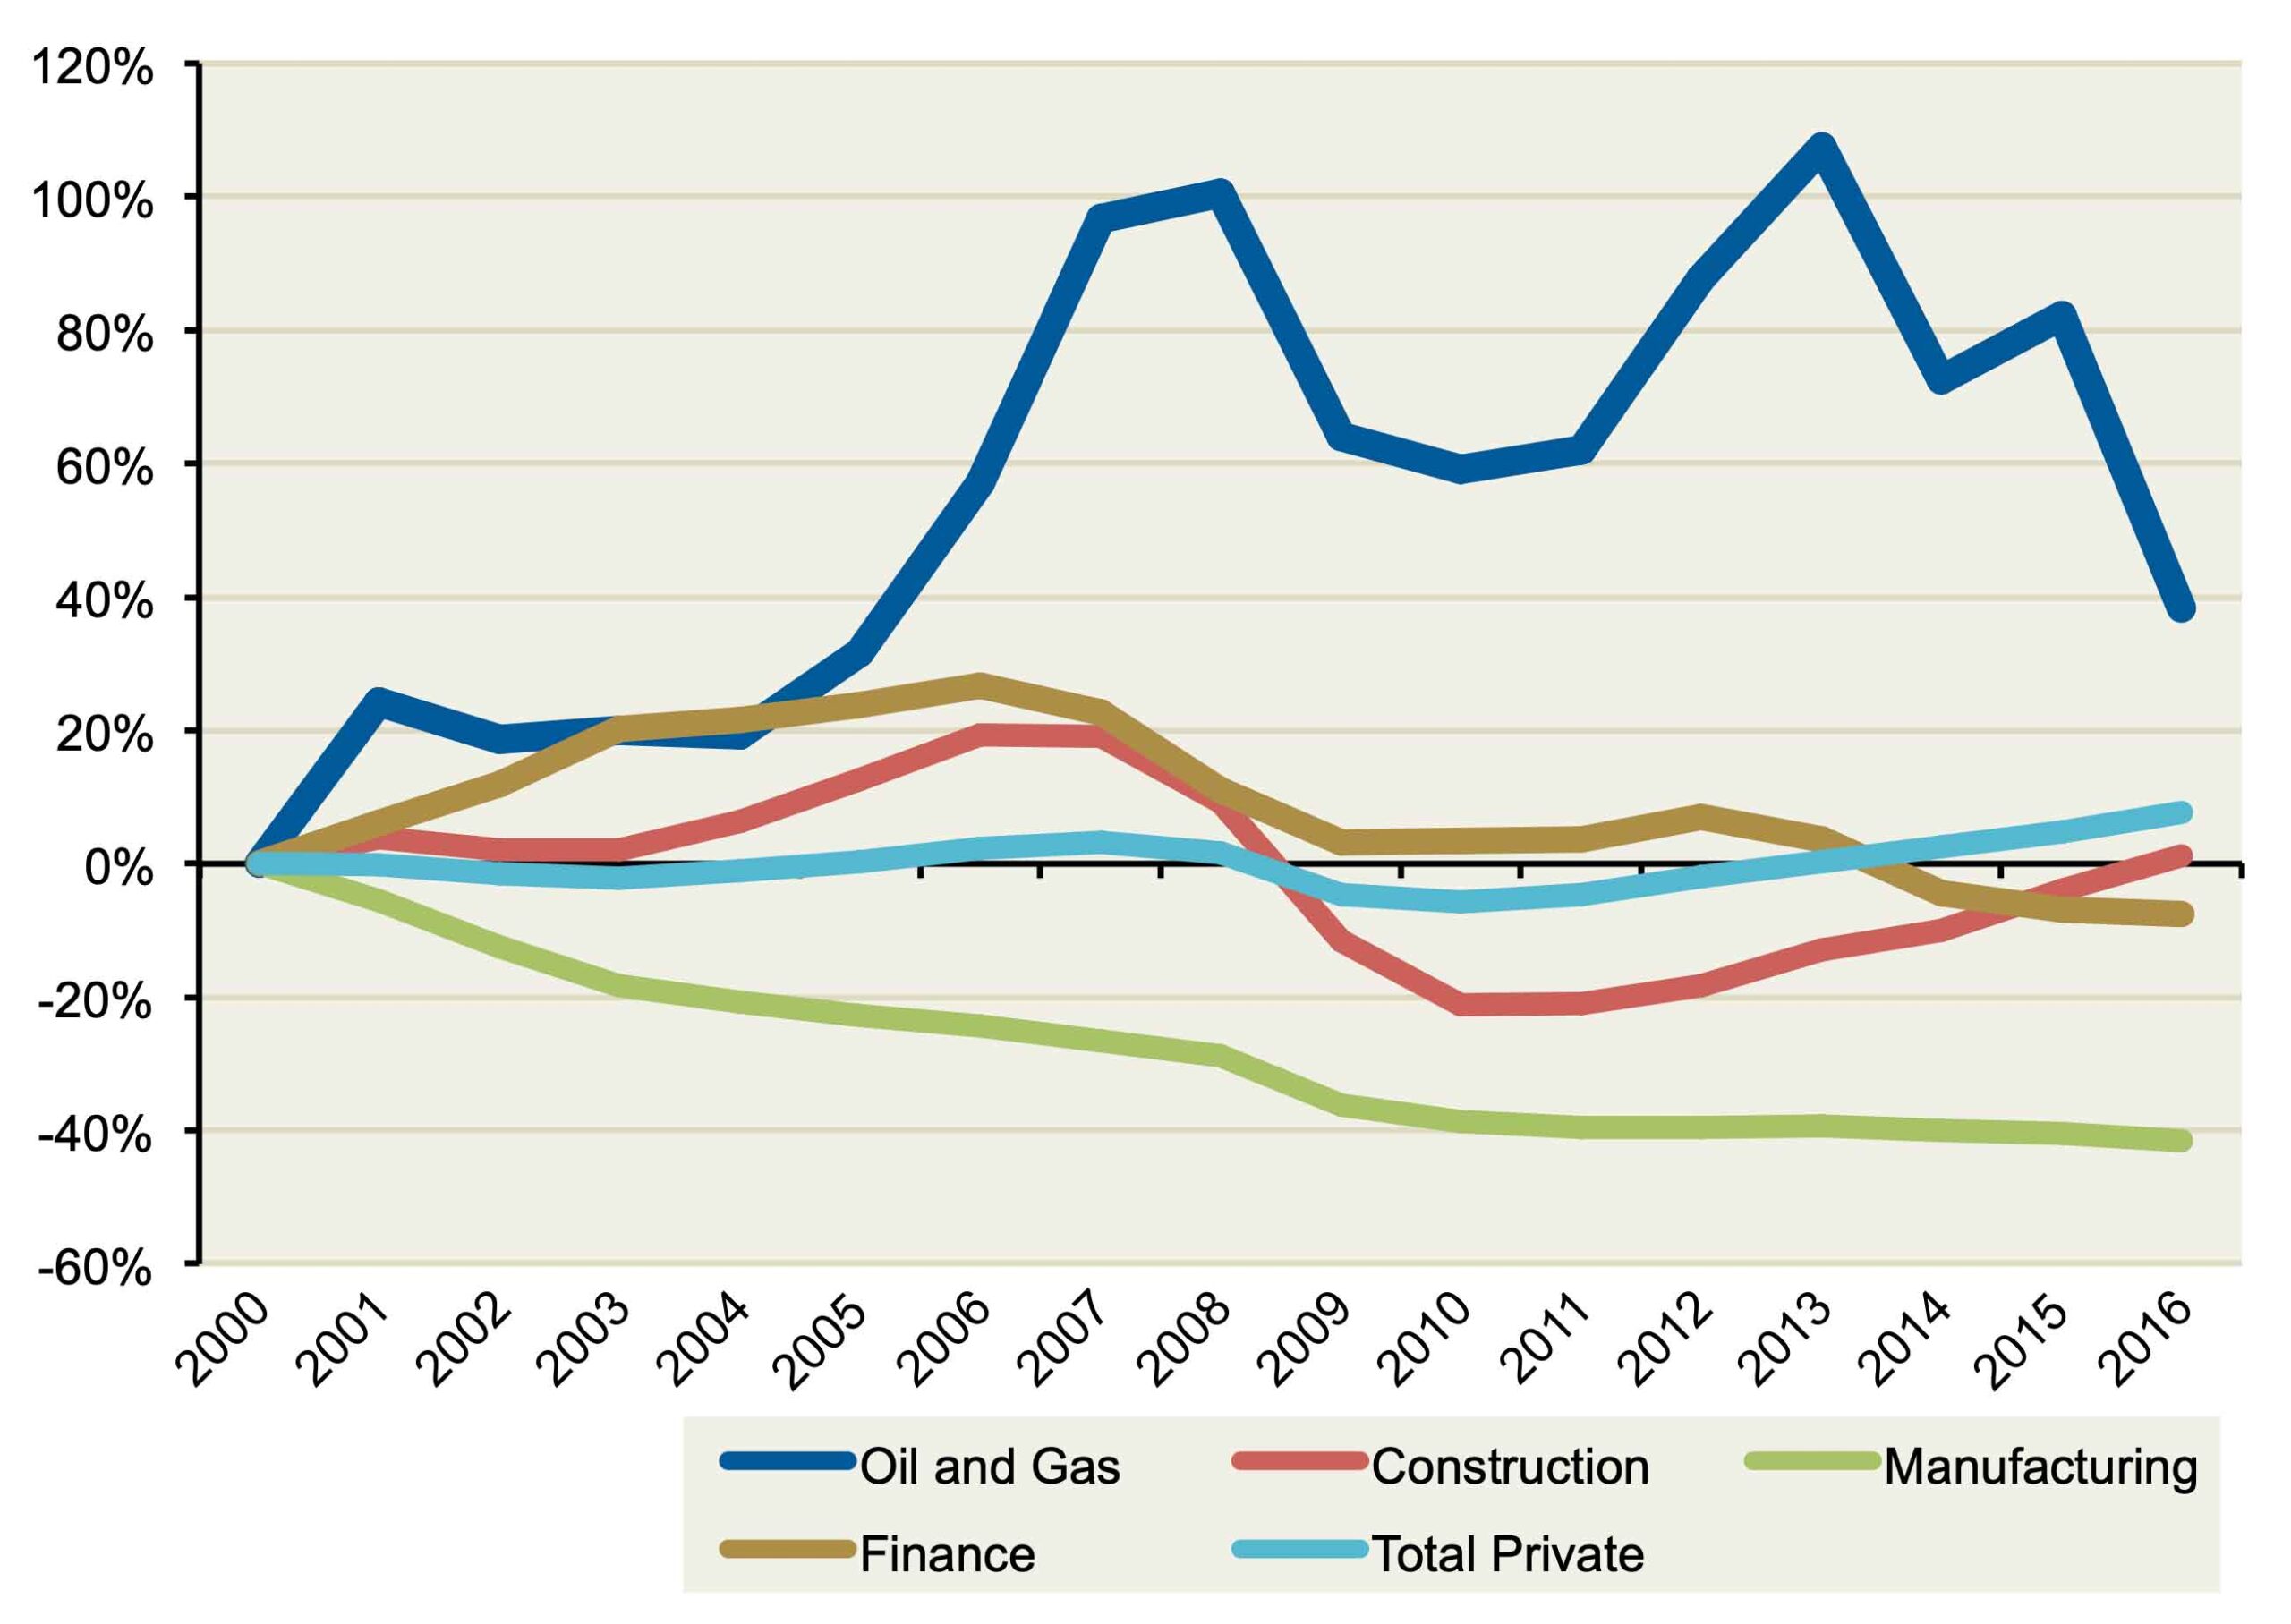
Despite the recent decline in world oil prices and the associated cutbacks in the industry, employment and income attributable to the oil and gas production industry has outperformed other key sectors of the Los Angeles County economy in the 21st century. As shown in Figure 10, jobs in the oil and gas industry are up nearly 40 percent since 2000. This compares to a modest increase for the total private sector (excluding oil and gas extraction and support), a marginal increase in construction, and a major decline in manufacturing.
During the years immediately following the great recession, oil and gas production employment was one of relatively few industries adding jobs, offsetting some of the persistent declines in other segments of the Los Angeles County economy. In this regard, it played a significant stabilizing influence in the region.
Figure 10
Cumulative Percent Change in Jobs Since 2000 Los Angeles County
The oil production industry generates economic activity in Los Angeles County through three main channels.
In this section, we estimate the full economic and fiscal impacts of the oil and gas production industry on the Los Angeles region, taking into account all three channels. The direct effects for 2018 are based on recent historical data from oil companies and public sources. The indirect and induced effects (which we refer to collectively as “multiplier” effects) are estimated using the IMPLAN input- output models for Los Angeles City and Los Angeles County. A description of IMPLAN is provided in the accompanying box. Additional detail on data sources, methodology, and assumptions are provided in Appendix 1 of this report.
IMPLAN is an input-output modeling system that enables users to calculate the direct, indirect, and induced effects of output and/or spending in one industry on other industries located within a geographical region (national, state, county, metropolitan statistical area, or zip code). IMPLAN is widely used by academic institutions, federal, state, and local government agencies, and private companies for economic impact analyses. The model is based on benchmark U.S. input-output accounts produced by the U.S. Bureau of Economic Analysis (BEA). These accounts describe commodity inputs that are used by each industry to produce its output, the commodities produced by each industry, and the use of commodities by final consumers. The relationships in the national accounts are then modified by IMPLAN for each local region to take into account such factors as the relative size of the region’s various industrial sectors. Based on these inter-industry tables, IMPLAN calculates a total requirements table, which estimates the full impacts (including multiplier effects) of a given change in output in one industry on all other industries in the economy.
We estimate that oil and gas production currently supports $2.1 billion in economic output, $1.4 billion in gross regional product,9 8,325 jobs, and $713 million in labor income in Los Angeles County (see Figure 11). One-half of the job total is directly attributable to the oil and gas production and support industries. The other half is due to multiplier effects – that is, the jobs and labor income generated in other sectors of the economy that benefit from expenditures made by oil producers and their employees in the Los Angeles region.
9 Economic output is the annual value of sales generated by the oil and gas production industry and its suppliers. Gross regional product is akin to the widely-cited U.S. gross domestic product. It is equal to the “value added” by the oil and gas production industry and each of its suppliers. Value added for each industry is equal to its total economic output minus the cost of its inputs (i.e. purchases from other industries). In the case of oil and gas production, these inputs include, for example, energy purchased from utilities to power its wells and maintenance services purchased from contractors needed to keep the wells operating. By backing out the cost of inputs, gross regional product avoids “double counting” raw materials, parts, and business services used as products are assembled, distributed and ultimately sold on the retail market.
Figure 11
Economic Impacts Of Oil and Gas Production Industry in 2018 Los Angeles County
(Dollars in Millions)
| Type of Impact | Economic Output | Gross Regional Product | Number of Jobs | Labor Income |
|---|---|---|---|---|
| Direct | $1,310 | $900 | 4,246 | $461 |
| Indirect | 350 | 220 | 1,006 | 91 |
| Induced | 460 | 280 | 3,072 | 161 |
| Total | $2,120 | $1,400 | 8,325 | $713 |
| Multiplier | 1.6 | 1.6 | 2.0 | 1.5 |
Oil and gas production within Los Angeles City directly and indirectly supports $275 million in economic output, 1,123 jobs, and $115 million in labor income (see Figure 12). These estimates reflect jobs associated with the 2.7 million barrels of oil production, as well as headquarter operations for two major oil production companies in the City.
Figure 12
Economic Impacts Of Oil and Gas Industry in 2018 – Los Angeles City (Dollars in Millions)
| Type of Impact | Economic Output | Gross Regional Product | Number of Jobs | Labor Income |
|---|---|---|---|---|
| Direct | $175 | $110 | 530 | $76 |
| Indirect | 29 | 18 | 122 | 14 |
| Induced | 71 | 43 | 471 | 25 |
| Total | $275 | $171 | 1,123 | $115 |
| Multiplier | 1.6 | 1.6 | 2.1 | 1.5 |
County. We also estimate that oil and gas producers in Los Angeles County generate about $205 million in annual taxes paid to state and local governments. Of this total, $116 million is related to taxes and fees paid to the State (a significant portion of which is distributed back to the County to support public safety, education, health, and social services programs), and $89 million is related to taxes and fees collected by local governments and used to support local programs.
As indicated in Figure 13, these revenues are from: property taxes on oil reserves and equipment; state corporate taxes on company profits; personal income taxes on wages and royalties; state and local sales taxes on oil producers’ purchases of materials, fuels, and equipment; severance taxes imposed by about a dozen cities; and the DOGGR administrative fee used to support a variety of its regulatory activities. The multiplier effects include (1) personal income taxes paid on employees’ wages, and (2) state and local taxes paid on subsequent rounds of income and expenditures generated by supplying businesses and their employees.
Figure 13
State and Local Taxes Generated by Oil and Gas Production
in Los Angeles County and Los Angeles City in 2018 (Dollars in Thousands)
| Los Angeles County | Los Angeles City | |||
|---|---|---|---|---|
| Tax Source | Total Amount | Per Barrel Amount | Total Amount | Per Barrel Amount |
| On producers & royalty owners: | ||||
| State: | ||||
| Corporation Tax | $25,000 | $1.15 | $3,200 | $1.15 |
| Personal income | 10,270 | 0.47 | 1,320 | 0.47 |
| Sales | 14,110 | 0.65 | 2,010 | 0.72 |
| DOGGR | 12,550 | 0.58 | 1,610 | 0.58 |
| Total, state | $61,930 | $2.85 | $8,140 | $2.91 |
| Local: | ||||
| Property | $44,140 | $2.03 | $5,880 | $2.11 |
| Sales | 9,140 | 0.42 | $1,170 | 0.42 |
| Severance | 8,710 | 0.40 | 0 | – |
| Other | 3,270 | 0.15 | 420 | 0.15 |
| Total, local | $65,260 | $3.00 | $7,470 | $2.81 |
| Multiplier impacts: | ||||
| State | $54,500 | $2.50 | $6,920 | $2.48 |
| Local | 23,600 | 1.09 | 3,400 | 1.21 |
| Total, multiplier impacts | $72,970 | $3.59 | $8,680 | $3.69 |
| Multiplier impacts: | ||||
| State | $54,500 | $2.50 | $6,920 | $2.48 |
| Local | 23,600 | 1.09 | 3,400 | 1.21 |
| Total, multiplier impacts | $72,970 | $3.59 | $8,680 | $3.69 |
| Combined, Direct and Multiplier: | ||||
| State | $116,430 | $5.36 | $15,060 | $4.94 |
| Local | 88,860 | 4.09 | 10.870 | 3.61 |
| Total, combined | $205,290 | $9.45 | $25,930 | $8.55 |
Los Angeles City. State and local taxes generated by oil and gas production within Los Angeles City boundaries total $26 million, of which $15 million is state taxes and $11 million is local taxes. Most of the local taxes are from sales and property taxes.
An important point about our economic and revenue estimates for 2018 is that they are being made when oil prices are coming off a cyclical low point. Industry profits, reserve valuations, capital expenditures, and employment are down sharply.10 For these reasons, we estimate that the economic and revenue contributions are down by more than 30 percent from the peak 2014 levels.
In order to estimate the impacts of setback ordinances having an assumed operative date of 2020, we have projected the baseline levels of the oil and gas production industry’s economic and tax contributions forward to 2025.
Crude oil price assumption. A key assumption underlying these projections is the future level of crude oil prices. These prices have a major impact on producers’ future cash flows, and thus the amount of internal funds they have to support capital expenditures for new wells and improvements aimed at maximizing recovery of oil and gas reserves. We assume that oil prices will rise moderately over the next seven years, as shown in Figure 14. The specific price projections are based on an average of the World Bank and U.S. Energy Information Agency’s (EIA) long-term price forecasts made in early 2017, adjusted for assumed price differentials between world benchmark oil prices and (lower) prices for heavy California crude. Other assumptions underlying our short and long-term forecasts are discussed in Appendix 1.
10 The major decline since 2014 is tied to four main factors: (1) a slowdown in emerging market economies, particularly in China; (2) sharply rising U.S. shale production that persisted even after prices declined; (3) recent increases in crude production in Iran following the lifting of sanctions; and (4) until recently, the lack of output reductions among OPEC countries, whose members maintained production to both (a) avoid losses in market share and (b) drive U.S. shale producers out of business. Looking ahead, most forecasts anticipate, to varying degrees, an upswing in prices as supplies tighten and global demand picks up. On the supply side, OPEC finally curtailed production beginning in late 2016 and renewed the restraints until 2018. The recent drop in exploration and new development spending by major producers imply fewer new supplies coming on line in future years to replace depleted reserves. On the demand side, energy consumption is rising and economic growth is improving in both developed and emerging markets, which implies further increases in consumption in the coming years.
Figure 14
Forecast of Average Price Per-Barrel of Oil Received by Los Angeles County Producers (In Constant 2018 Dollars)
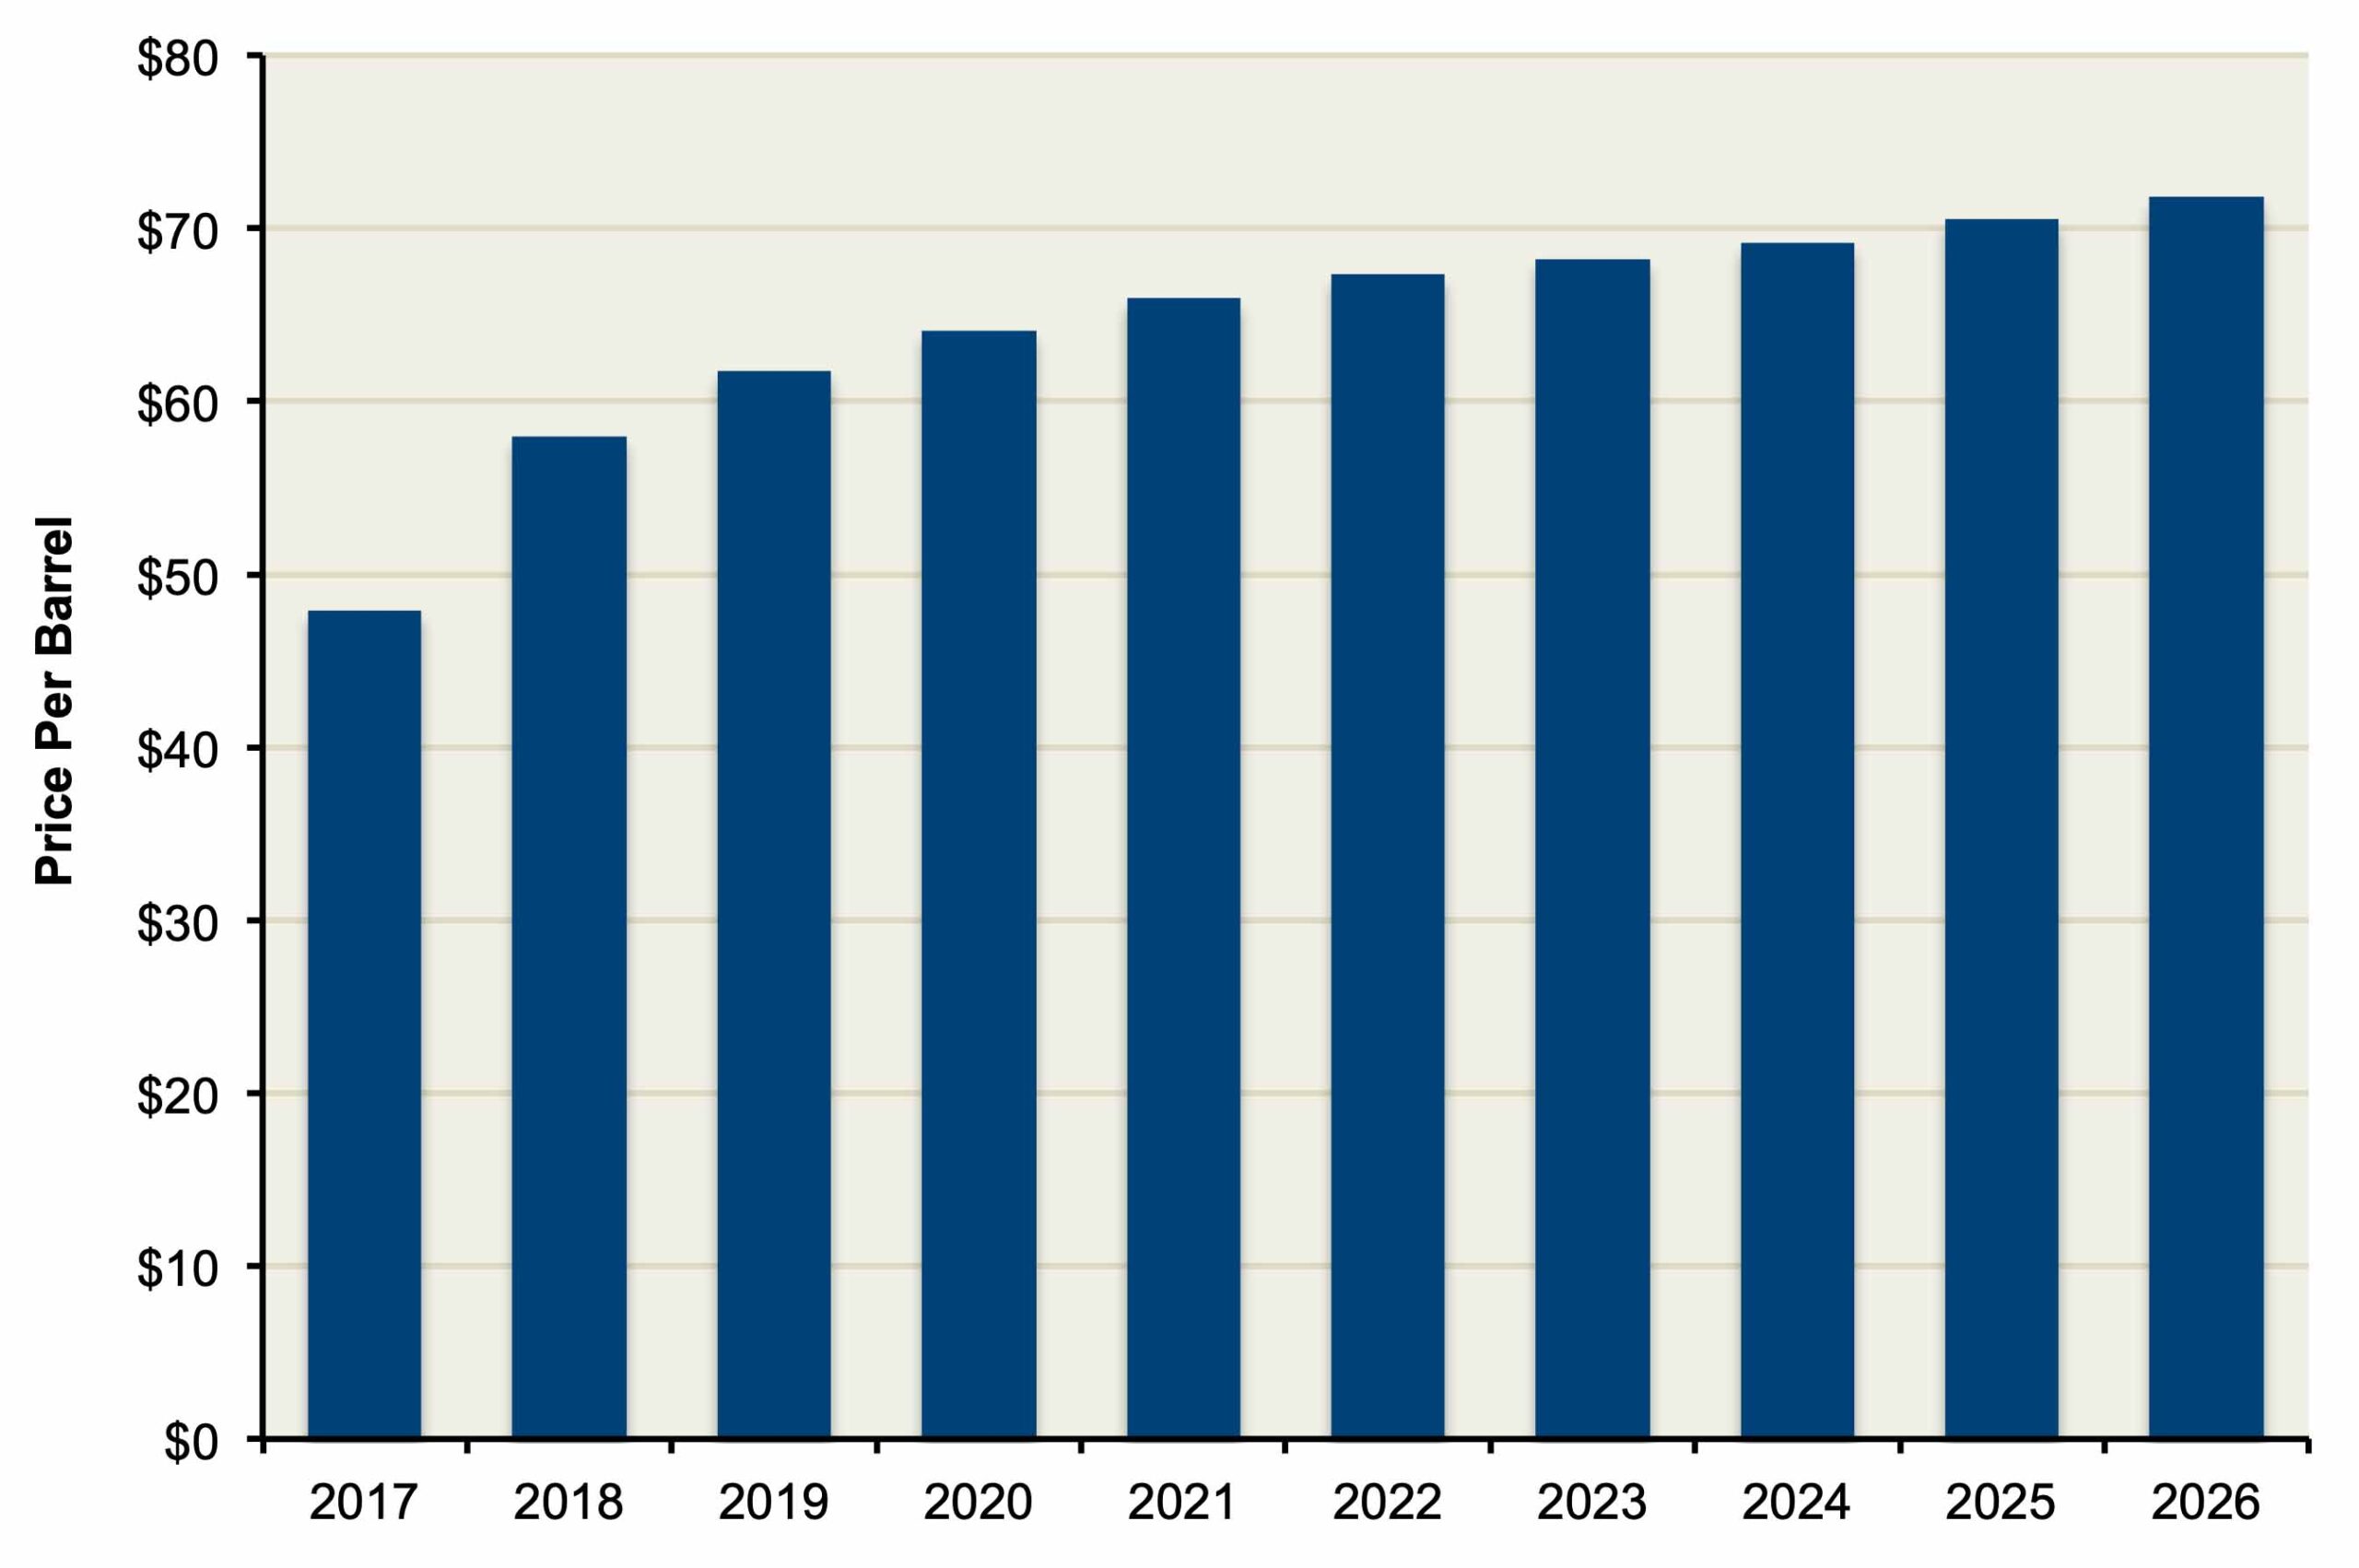
Figure 15 provides our projections of oil industry-related output, jobs, labor income, state tax payments and local tax payments for Los Angeles City and Los Angeles County. The figures shown represent average levels for 2020 through 2025. For this time period, average annual economic output directly and indirectly related to the oil production industry will be $3.1 billion in Los Angeles County. Employment will average 11,000 jobs, labor income will average $960 million, and state and local taxes combined will average $275 million per year. The average amounts for the 2020-2025 period are moderately higher than today’s levels, reflecting the beneficial effects of expected higher oil prices on profits, capital expenditures, hiring, and reserve valuations in the years ahead.
Figure 15
Projected Economic Contributions of Oil and Gas Production Industry Average Annual Amounts, 2020-2025
(Dollars In Millions)
| Contribution to: | Los Angeles County | Los Angeles City |
|---|---|---|
| Employment | ||
| Direct | 5,600 | 700 |
| Multiplier | 5,410 | 780 |
| Total | 11,010 | 1,480 |
| Labor Income | ||
| Direct | $620 | $103 |
| Multiplier | 340 | 52 |
| Total | $960 | $155 |
| Regional Product: | ||
| Direct | $1,350 | $160 |
| Multiplier | 670 | 110 |
| Total | $2,020 | $270 |
| Economic Output | ||
| Direct | $1,960 | $260 |
| Multiplier | 1,100 | 170 |
| Total | $3,060 | $430 |
| State Taxes | ||
| Direct | $85 | $10 |
| Multiplier | 75 | 8 |
| Total | $160 | $18 |
| Local Taxes | ||
| Direct | $85 | $10 |
| Multiplier | 35 | 7 |
| Total | $115 | $17 |
In April 2017, Los Angeles City Council President, Herb Wesson, introduced a motion calling for a study analyzing the feasibility of a buffer zone or setback for wells located next to “sensitive land uses,” defined broadly in the motion as “homes, schools, hospitals, parks and public places.” Community activists have suggested a 2,500-foot buffer around all production wells in the City. In response to these concerns, the Los Angeles County Department of Public Health published an evaluation of the pubic health and safety risks associated with oil and gas production in the County in February 2018. In this study, the County reviewed setback ordinances adopted by other jurisdictions and found that these jurisdictions defined sensitive land use as “housing, schools, faith institutions and hospitals.” Based on this definition, we evaluated the economic and fiscal impacts that setback requirements would have on the Los Angeles City and Los Angeles County, taking into account both direct and multiplier effects.
In March 2018, Catalyst Environmental Solutions released two studies of the effects of setback requirements on oil and gas well production within the County: one specifically looked at the effects of setback requirements imposed by Los Angeles City; the other looked at the impacts of the requirements being imposed throughout Los Angeles County.
Both studies found major impacts. For example, even a 500-foot setback requirement would eliminate 63 percent of production within Los Angeles City. A 1,500-foot buffer would eliminate 86 percent of production, and a 2,500 buffer would eliminate 87 percent of oil and gas production within City boundaries (see Figure 16).
Figure 16
Crude Oil Production Losses From Setback Ordinances
| Setback Distance | |||
|---|---|---|---|
| Geographic Region | 500 feet | 1,500 feet | 2,500 feet |
| Los Angeles City | |||
| Amount (barrels) | 1,726 | 2,344 | 2,383 |
| Percent reduction | 63% | 86% | 87% |
| Los Angeles County | |||
| Onshore: | |||
| Amount (barrels) | 5,139 | 7,844 | 9,630 |
| Percent reduction | 43% | 66% | 81% |
| Offshore: | |||
| Amount (barrels) | 0 | 0 | 1,337 |
| Percent reduction | 0% | 0% | 14% |
| Combined County Onshore & Offshore: | |||
| Amount (barrels) | 5,139 | 7,844 | 10,967 |
| Percent reduction | 24% | 37% | 52% |
If imposed throughout the County, a 500-foot setback would eliminate 43 percent of onshore production and about one-quarter of combined on-shore and offshore production. A 2,500-foot setback would eliminate 81 percent of onshore production and slightly over one-half of combined onshore and offshore production.
Not surprisingly, production cutbacks of these magnitudes would have substantial effects on economic and revenue activity in the Los Angeles basin. We have estimated these impacts under two scenarios – one that assumes the setbacks are imposed by Los Angeles City only, and another that assumes the setbacks are adopted County-wide.
Scenario 1 – setbacks adopted by Los Angeles City
As indicated in Figure 17, the imposition of even a 500-foot setback requirement by the City would eliminate a substantial amount of economic activity associated with oil and gas production within its boundaries. The 63 percent reduction in oil production associated with a 500-foot setback would result in the average annual reduction of 890 jobs during 2020-2025 period, many of them high-paying. It would also result in an average loss of $88 million loss in labor income and $255 million economic output within the City. Under a 2,500-foot setback requirement the average annual losses would jump to 1,221 jobs, $122 million in labor income, and $344 million in economic output.
Figure 17
Economic and Revenue Impacts of Setback Ordinances Adopted by Los Angeles City Only
(Average Annual Reduction, 2020-2025)
| Setback Distance | |||
|---|---|---|---|
| Impact On: | 500 feet | 1,500 feet | 2,500 feet |
| Employment | |||
| Direct | 420 | 570 | 576 |
| Multiplier | 470 | 640 | 645 |
| Total | 890 | 1,210 | 1,221 |
| Labor Income ($ Millions) | |||
| Direct | $60 | $81 | $82 |
| Multiplier | 28 | 39 | 40 |
| Total | $88 | $120 | $122 |
| Regional product ($ Millions) | |||
| Direct | $105 | $141 | $143 |
| Multiplier | 60 | 71 | 72 |
| Total | $165 | $212 | $215 |
| Economic output ($ Millions) | |||
| Direct | $165 | $225 | $227 |
| Multiplier | 90 | 115 | 117 |
| Total | $255 | $340 | $344 |
| State taxes ($ Millions) | |||
| Direct | $6 | $8 | $8 |
| Multiplier | 6 | 7 | 7 |
| Total | $12 | $15 | $15 |
| Local Taxes ($ Millions) | |||
| Direct | $6 | $8 | $9 |
| Multiplier | 4 | 5 | 5 |
| Total | $9 | $12 | $14 |
| Combined, S/L Taxes ($ Millions) | |||
| Direct | $12 | $16 | $17 |
| Multiplier | 10 | 12 | 12 |
| Total | $22 | $28 | $29 |
The economic losses would translate into losses in state and local tax revenues ranging from $22 million to $29 million per year. Local revenue losses would occur due to reductions in assessed values and property taxes on oil and gas reserves, as well as reduced sales and business taxes. State taxes would be diminished because of lower sales, profits, and personal incomes associated directly and indirectly with oil and gas production in the City.
Scenario 2 – County-wide adoption of setbacks
As indicated above, a 500-foot setback would eliminate about one-quarter of onshore of combined onshore and offshore production in Los Angeles County, while a 2,500- foot setback would eliminate about one-half of total County-wide production.
The corresponding reductions in economic activity would be substantial. They include losses of up to 5,685 jobs, about one-half of which are in the high-paying oil and gas industries. The other half would be related to losses in businesses throughout the economy that supply goods services to oil producers and their employees. The setbacks would also produce losses of up to $1.6 billion in economic output, and just under $500 million in labor income.
County-wide revenue effects. The corresponding reductions in revenues would include $75 million in state taxes and $56 million in local taxes. The local losses would primarily reflect reductions in property taxes, which would be adversely affected by declines in assessed values of oil and gas reserves and equipment. They would also include millions in reduced local sales taxes on oil production company purchases of materials, and severance taxes collected by Long Beach, Signal Hill, Beverly Hills, Inglewood, Montebello and other cities within the region. State tax losses would include reduced sales taxes on oil production company purchases, corporate taxes on business profits, and personal income taxes on royalties. They also include multiplier effects of these losses on businesses that supply goods and services to oil producers and their employees.
Additional jobs at risk in distribution industries. Our estimates take into account the direct effects of the production losses on the oil and gas production industry as well as multiplier effects on industries that supply goods and services to oil and gas producers and their employees.
In addition to these losses, setback requirements would also put at risk a large number of jobs in distributive industries involved in the shipment of crude oil to the refineries. These include a portion the 1,900 high-paid employees in oil and gas pipeline transportation and construction industries shown earlier in Figure 6, as well as hundreds of additional employees working in trucking, crude oil wholesale merchandising, and storage and distribution facilities. The number of these jobs that would be lost partly depends on how crude oil distribution networks would evolve following the loss of local oil production. However, we believe that as many as 1,000 jobs associated with the current distribution network would be at risk if a 2,500 setback were implemented. Taking into account multiplier effects, the total would likely reach 2,000 or more. This would bring the combined total related to oil production and distribution to over 7,600 jobs.
Figure 18
Economic and Revenue Impacts of Setbacks Adopted Throughout Los Angeles County, (Annual Average Reduction, 2020-2025)
| Los Angeles County | Los Angeles City | |||||
|---|---|---|---|---|---|---|
| Setback Distance | 500 feet | 1,500 feet | 2,500 feet | 500 feet | 1,500 feet | 2,500 feet |
| Reduction in: | ||||||
| Employment: | ||||||
| Direct | 1,360 | 2,075 | 2,900 | 420 | 570 | 576 |
| Multiplier | 1,305 | 1,995 | 2,785 | 680 | 980 | 1,205 |
| Total, employment | 2,665 | 4,070 | 5,685 | 1,100 | 1,550 | 1,790 |
| Labor Income ($ Millions) | ||||||
| Direct | $150 | $230 | $320 | $60 | $80 | $81 |
| Multiplier | 85 | 130 | 175 | 41 | 60 | 75 |
| Total, labor income | $235 | $360 | $495 | $102 | $140 | $159 |
| Regional product ($ Millions) | ||||||
| Direct | $325 | $500 | $695 | $105 | $141 | $143 |
| Multiplier | 165 | 255 | 355 | 80 | 115 | 140 |
| Total, regional product | $490 | $755 | $1,050 | $185 | $256 | $284 |
| Economic output: ($ Millions) | ||||||
| Direct | $475 | $725 | $1010 | $165 | $225 | $227 |
| Multiplier | 265 | 405 | 570 | 130 | 180 | 230 |
| Total | $740 | $1,130 | $1,580 | $295 | $405 | $460 |
| State taxes ($ Millions) | ||||||
| Directly on producers | $18 | $27 | $38 | $6 | $8 | $8 |
| Multiplier | 17 | 27 | 37 | 11 | 12 | 12 |
| Total, state | $35 | $54 | $75 | $17 | $20 | $20 |
| Local Taxes ($ Millions) | ||||||
| Directly on producers | $17 | $28 | $40 | $6 | $8 | $9 |
| Multiplier | 8 | 12 | 16 | 6 | 8 | 9 |
| Total, local | $25 | $40 | $56 | $12 | $16 | $18 |
| Combined, S/L Taxes ($ Millions) | ||||||
| Directly on producers | $35 | $55 | $78 | $12 | $16 | $17 |
| Multiplier | 25 | 39 | 53 | 17 | 20 | 21 |
| Total, combined state and local | $60 | $94 | $131 | $29 | $36 | $38 |
Impact of County-wide adoption of setbacks on Los Angeles City. As shown in Figure 18, Los Angeles City would face a loss of up to 1,790 jobs, $159 million in labor income, and $38 million in state and local taxes as a result of County-wide adoption of setbacks. These amounts are greater than the amounts shown in Figure 17 for the adoption of setbacks solely by Los Angeles City. This is because, under a County-wide adoption of setbacks, Los Angeles City would experience a reduction in economic activity related to both (1) a shutdown of most or all production within its own boundaries, and (2) the impact of production cutbacks in neighboring communities on “cross-border” purchases from businesses within the City.
The large (up to $131 million) County-wide reduction in state and local taxes is notable in the context of challenges currently confronting local governments in California. Although representing only a modest share of overall local government revenues in Los Angeles County, the potential loss of these revenues takes on increased importance when it is considered that (1) local governments have a limited amount of discretionary funds in their budgets, and (2) many cities in Los Angeles County face major budget pressures related to employee contracts, rising costs for infrastructure and homeless services, lawsuit settlements, and pensions.
The tax revenues we identified are discretionary funds that can be used to address these rising costs. It is also worth noting that over 75 percent of the state taxes we identified are returned to local governments in the form of payments for health, social services, education, and public safety programs administered by local governments. This is particularly important for Los Angeles County, which receives a large percentage of those state payments.
Aside from the economic activity associated with annual oil and gas production, the oil and gas fields in Los Angeles County represent a major source wealth to the region. This wealth would be sharply diminished if production were curtailed through setback ordinances.
The economic value of these reserves can be measured by estimating the present discounted value of after-tax cash flows (i.e. annual revenues minus operational and investment costs) generated from all future extraction of oil from these reserves. The actual value depends on several factors, one of the most important of which is the future price of crude oil. The price level affects both profitability of oil production and (given the rising costs of extraction as reserves are depleted) the amount of total reserves that are economically viable. To provide a reasonable range of potential values, we have developed calculations based on three long-term price scenarios:
Our estimates are also based on assumptions about future levels of oil production and costs, which are outlined in Appendix 1. For purposes of these projections, we used an inflation-adjusted discount rate of 13 percent.
Based on these assumptions, we estimate that the economic value of the oil reserves would be worth $1.2 billion under the lower-end oil price forecast, $2.3 billion under the moderate price forecast, and $3.4 billion under the high-end price forecast.
If the County were to impose a 500-foot setback requirement today, the reduction in the value of the oil reserves would be between $290 million and $815 million, depending on the oil price scenario. The County-wide application of a 2,500-foot setback would reduce economic value of the reserves by $615 million at the low end, up to $1.7 billion at the high end.
Figure 19
Estimated Impact of Setback Ordinances on
Value of Oil and Gas Reserves in Los Angeles County (Dollars in Millions)
| Discounted Present Value of Los Angeles County Reserves | Low-End Price Forecast |
Moderate Forecast | High-End Forecast |
|---|---|---|---|
| Value Assuming No Restrictions | $1,200 | $2,300 | $3,400 |
| Loss In Value Due To: | |||
| – 500 Foot Setback | -$290 | -$550 | -$815 |
| – 1,500 Foot Setback | -$445 | -$850 | -$1,260 |
| – 2,500 Foot Setback | -$615 | -$1,170 | -$1,735 |
The actual reductions in the value of oil and gas reserves would also depend how soon production was banned. However, in all cases, the reduction in reserve values would represent major losses in wealth to mineral rights owners (including the City of Long Beach and the State of California) and oil producers. The lost value could also result in a major liability to the County if mineral rights owners and producers were to prevail in “takings” lawsuits under the United States and California Constitutions.11 At a minimum, the County would face millions of dollars in litigation costs defending against such lawsuits. If the plaintiffs were to prevail, the County would be required to pay the present value of the lost profits from the oil and gas that would no longer be recovered in these fields to the oil companies and owners of the mineral rights affected by the ordinance.
11 Under the “takings” theory, a city-, county- or voter-imposed restriction on production would result in the government “taking” a valuable asset owned by oil producers and mineral rights owners. As compensation, the City or County would be required to pay the affected individuals and entities an amount equal to the present value of the lost profits from the oil and gas that would no longer be recovered from the Los Angeles County oil fields. In December 2017, the Monterey County Superior Court ruled that a 2016 Monterey County ballot initiative, if applied, would constitute an unlawful taking of the property of certain oil producers and mineral rights owners.
Oil and gas production is an important source of high-paying jobs, economic activity, and tax revenues in Los Angeles basin. The major economic contributions reflect the large amount of oil extraction in the basin, the high wages paid by the industry, the presence of headquarter operations and a large network of support services and suppliers in the region, and the large amount of purchases made by oil producers from these suppliers to maintain production in the region’s mature oil fields. We expect these contributions to rise in future years as the crude oil market improves.
Adoption of setback ordinances by Los Angeles City and, particularly, throughout Los Angeles County would sharply reduce oil production and have major economic and fiscal impacts in the region. The adoption of such ordinances would eliminate many high-paying middle-class jobs in both professional and blue-collar occupations, and would result in less spending and fewer jobs in other sectors of the region. Imposition of setbacks would also reduce taxes available to support state and local government services in the region. Such ordinances would also restrict development surrounding the thousands of operating oil and natural gas wells in the County, magnifying the effects on employment, economic activity and tax revenues detailed in this report. Finally, the up to 11 million barrels of oil potentially affected by setback ordinances in the Los Angeles Basin represents 6 percent of statewide oil production. A loss of this amount would significantly increase California’s dependence on oil imports from foreign sources (to the detriment of the environment and public safety) and potentially make the State more vulnerable to shortages or price increases for gasoline and other refined petroleum products.
In this appendix we discuss the data sources, methods, and assumptions behind the estimates shown in this report.
Data Sources. Our estimates are based on information available as of late 2017 regarding crude oil production, as well as employment, wage payments, annual costs of production, tax, fee, and royalty payments, and other cost and revenue measures related to the oil production industry.
We developed this information from data supplied by oil producers, as well as from a variety of public sources. Examples of public data include: company expenditure data from SEC 10(k) annual filings; production data from the State Department of Conservation, Division of Oil, Gas, and Geothermal Resources (DOGGR); oil price data from the U.S. Energy Information Agency (EIA); and employment and wage data from the California Employment Development Department’s Quarterly Census of Employment and Wages. We also developed information on average local tax rates by reviewing budget data from government agencies operating within Los Angeles County.
Our estimates of well production within Los Angeles County are based on aggregate county-level data and maintained on the DOGGR website. Estimates for Los Angeles City are based on a combination of oil-field level data and individual well data available from DOGGR’s geographical information system (GIS) map. For fields that cross city boundaries, we obtained API identification code for each well within the City’s boundaries, recorded annual production levels for individual wells, and combined them to arrive at total production taking place within the City.
Methodology. From these data sources, we developed estimates of output, employment, wages, and taxes directly related to the industry for 2018. We then estimated the multiplier effects of company expenditures on the broader economy, using the IMPLAN input-output model for Los Angeles City and Los Angeles County. Using 2018 as a starting point, we developed projections forward to 2025, based on forecasts of crude oil prices, company expenditures, production levels, and other factors. Our economic and tax projections are based on a variety of statistical and financial-based models. For example, our estimates of future property tax payments follow the “income approach” used by assessors for establishing assessed values of oil and gas properties. Under this approach, property tax-assessed values of oil and gas reserves are based on the discounted present value of future income generated by production from that field. These expected incomes are based on assumptions about future production, crude oil prices, and industry costs for maintaining production.
Next, we assumed that production cutbacks resulting from setback requirements would have proportional impacts on well operations and overhead expenditures. Our estimates for most state and local taxes assume that production cutbacks will have proportional effects. The one key exception was the severance tax. The County impacts would be less-than-proportional because over 60 percent of local severance taxes are collected by the City of Long Beach, and much of those taxes are on offshore production that would be mostly unaffected by the setback ordinances.
Key Assumptions. Some of the key assumptions for our 2018 and multi-year projections are as follows:
12 Source of EIA forecast is “Annual Energy Outlook, 2017. Table: Total Energy Supply, Disposition, and Price Summary.” https://www.eia.gov/outlooks/aeo/data/browser/#/?id=1-AEO2017&cases=ref2017&sourcekey=0. Source of World Bank forecast is “World Bank Commodities Price Forecast (Nominal U.S. Dollars.) Released April 2017.” http://pubdocs.worldbank.org/en/662641493046964412/CMO-April-2017-Forecasts.pdf
Over 200,000 Californians standing together to support safe, affordable and reliable local oil and gas production.